
Mountain top radars
There are quite a lot of Radar systems installed in India for multiple purposes. Just in the last few years, the Government of India has been pushing forward the installation of weather radars for better predictability of monsoon and we all have to admit that it has been quite helpful. This year’s monsoon predictions were spot on with a few hiccups here and there, which is possible in any scientific prediction methodology and scientists are not to be blamed for that.
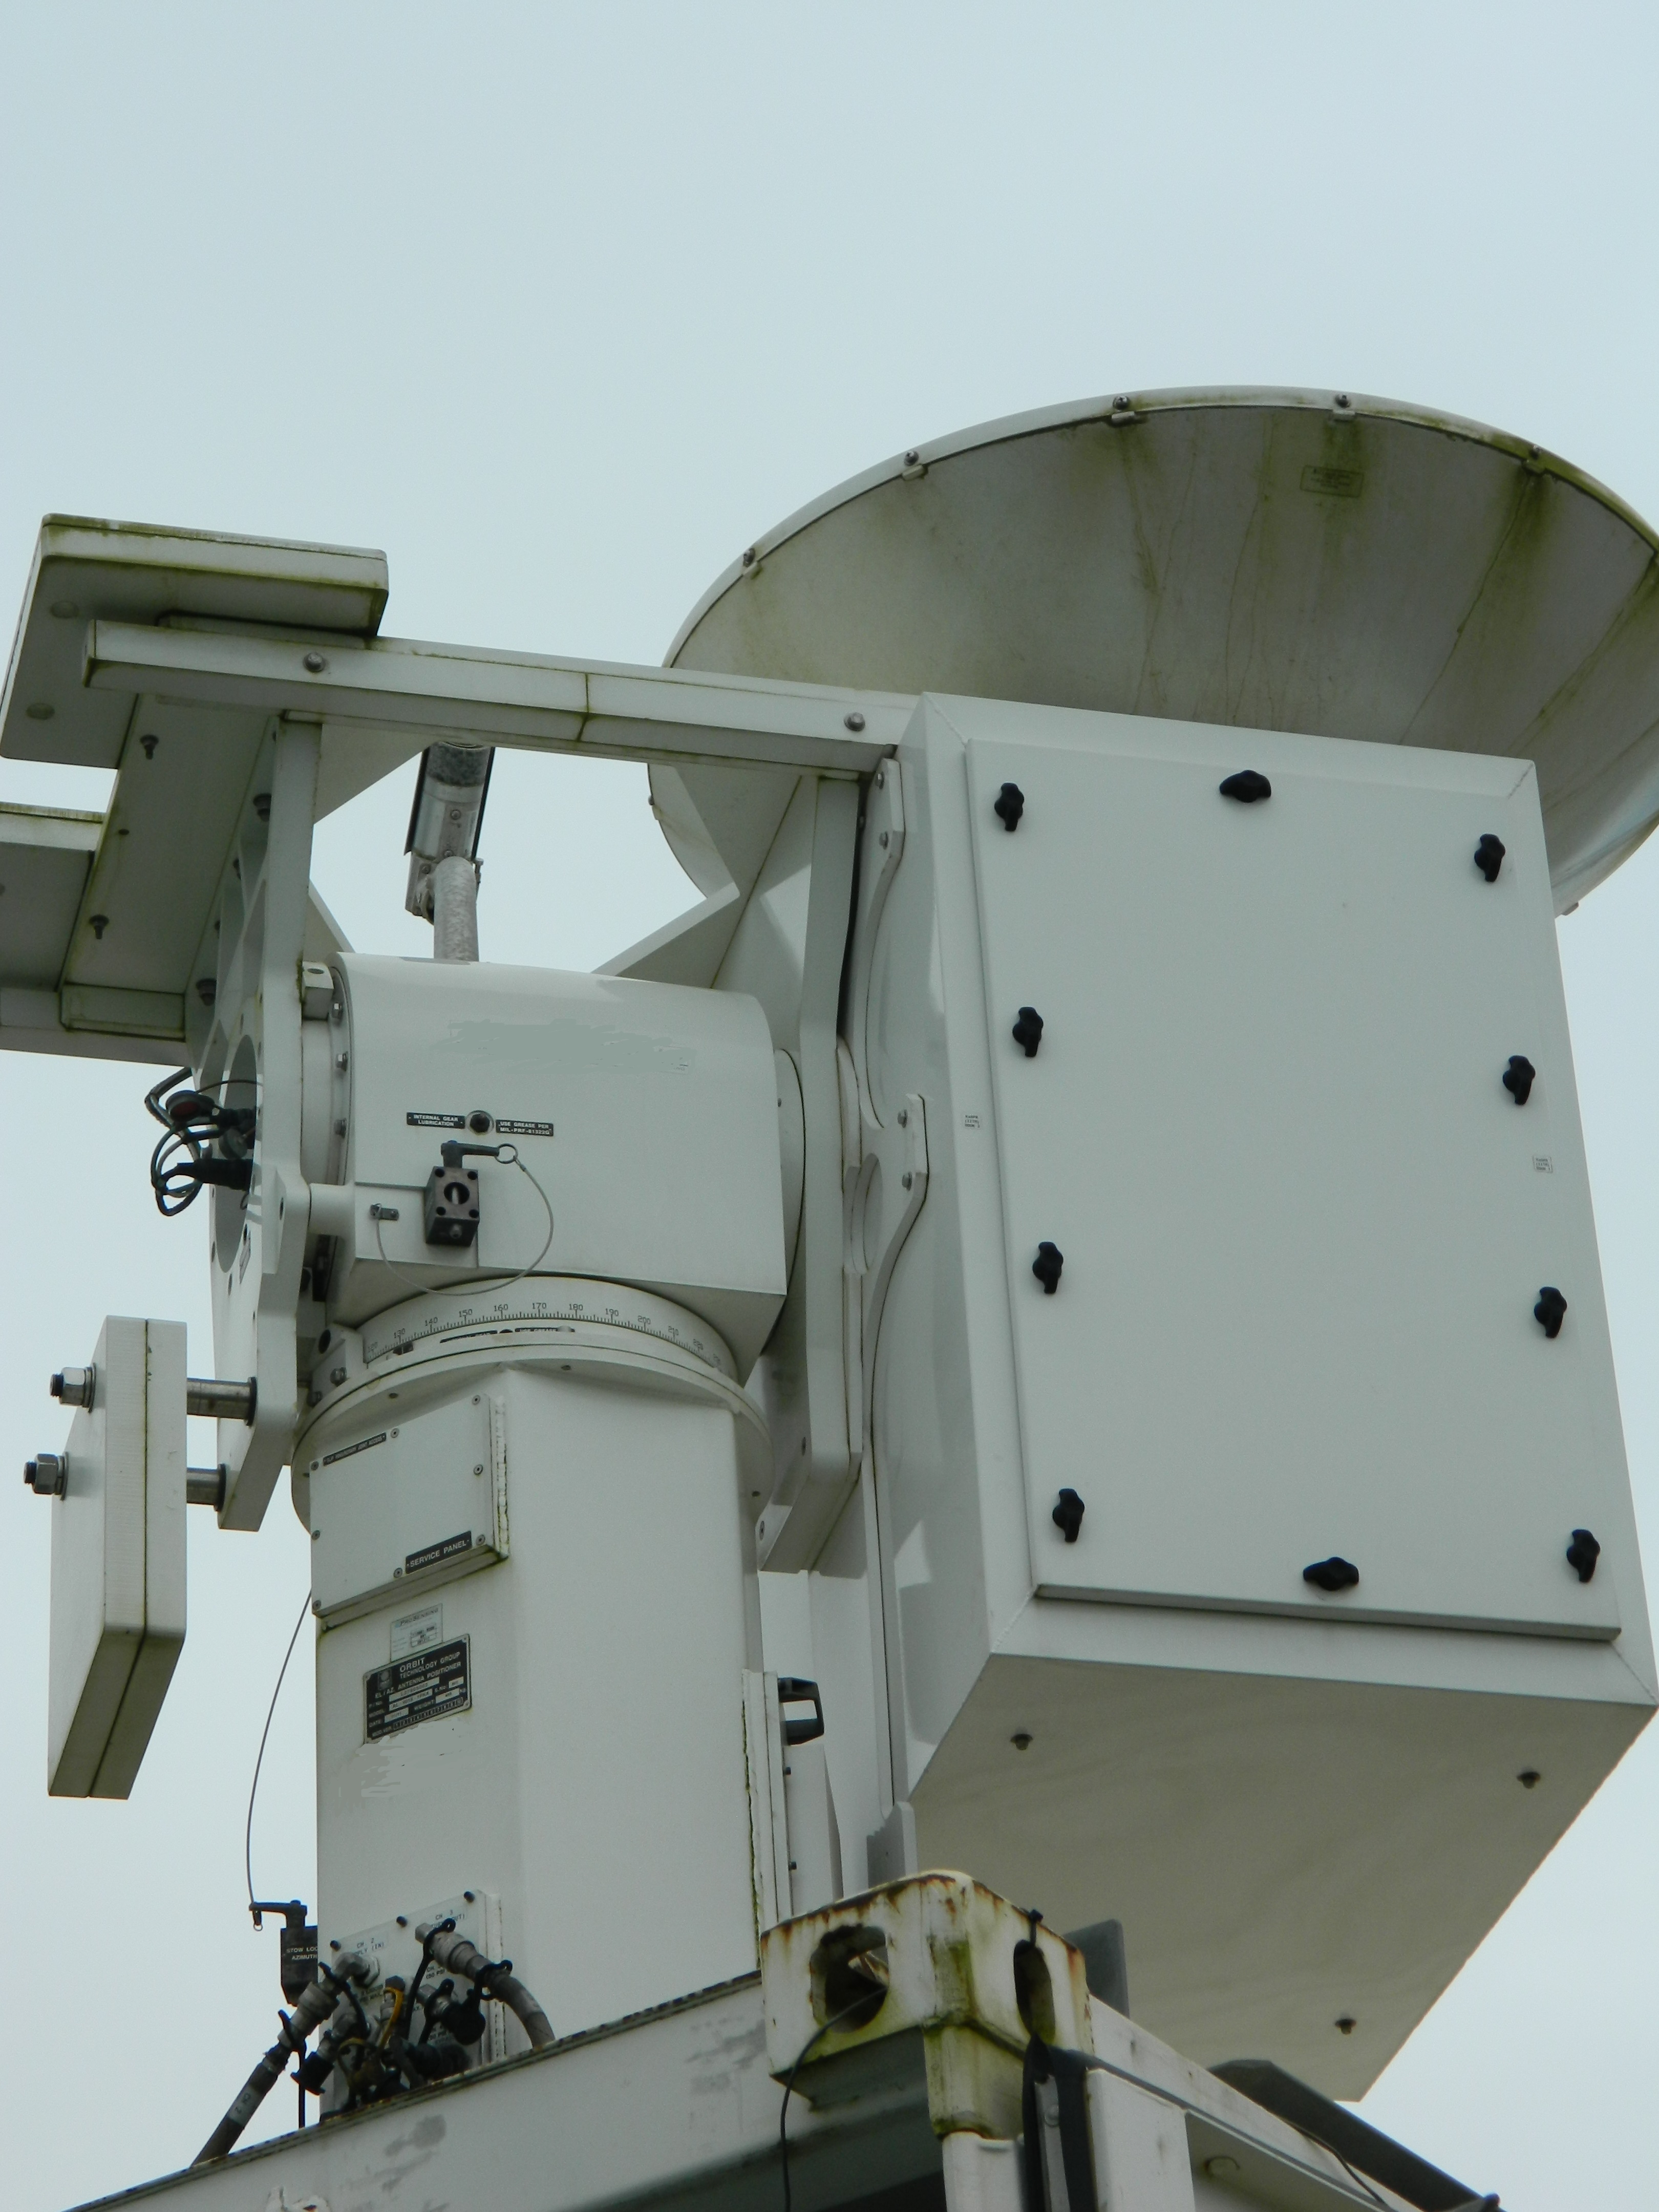
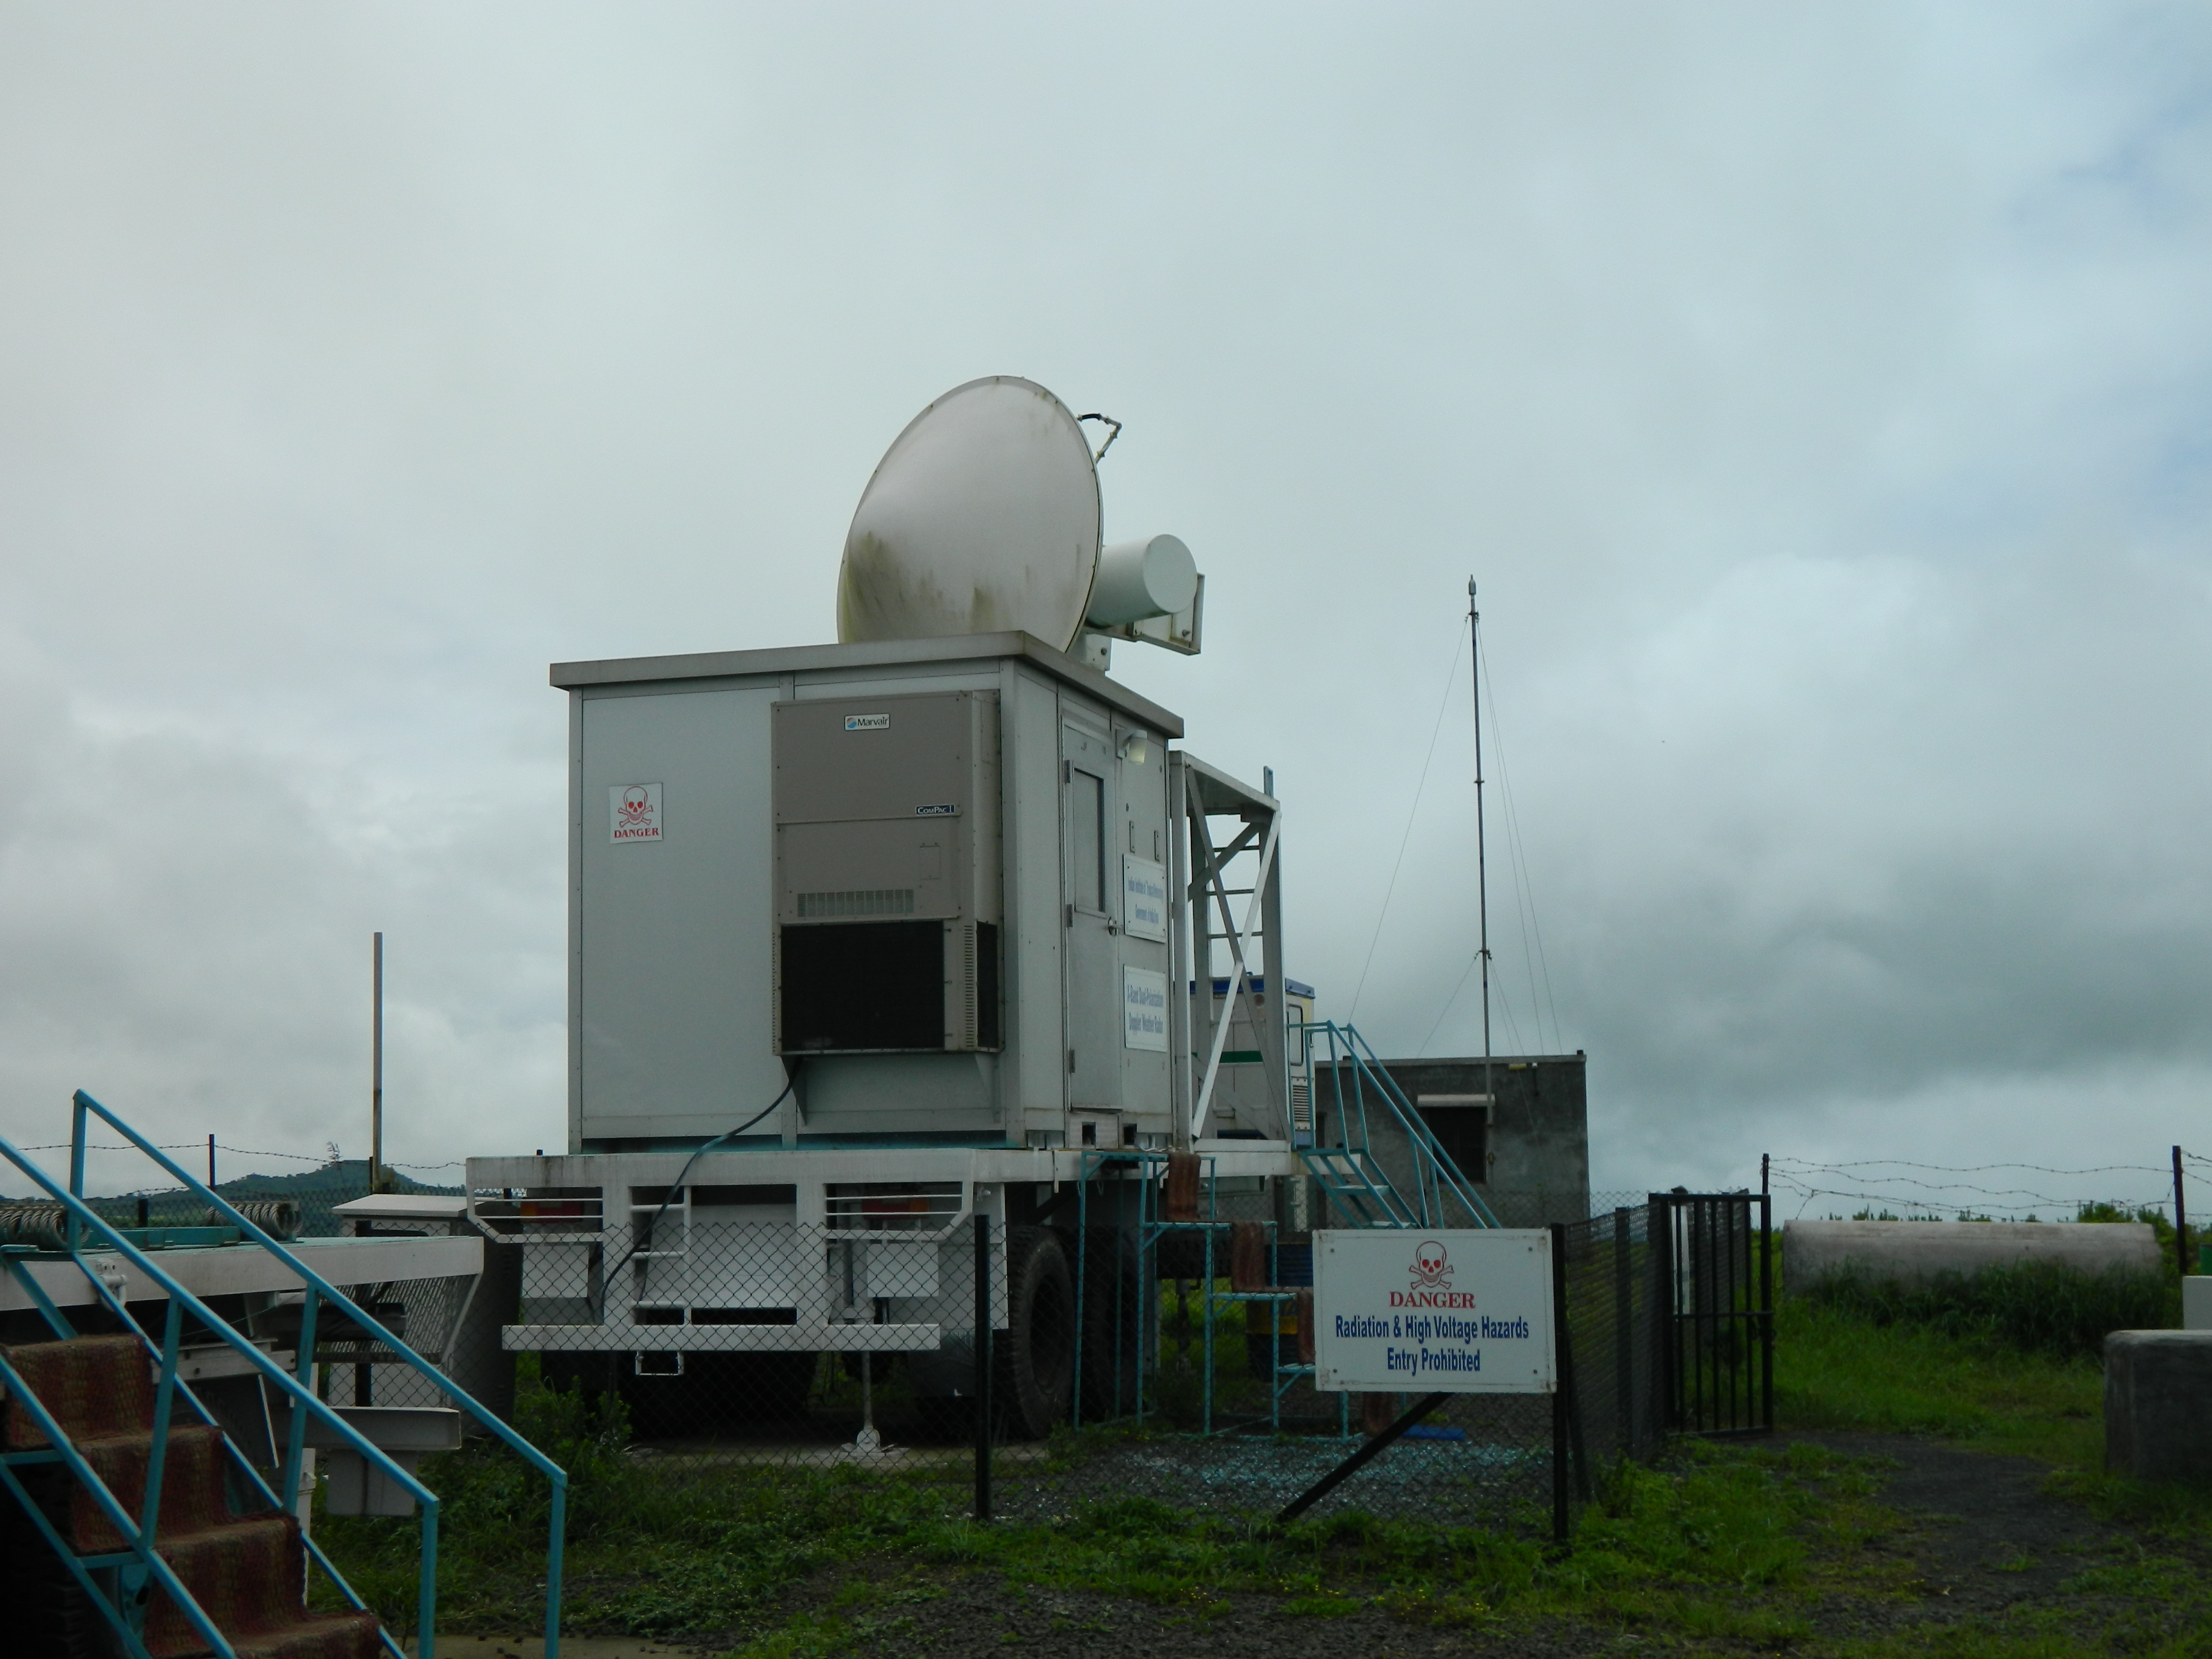
I had a chance to visit one of the mountain top radar facilities and high altitude weather research facilities in Maharashtra during this monsoon. Two radars are installed that operate continuously throughout the monsoon. One of the radar operates in the X-band (upwards of 10GHz) while the other operates in the Ka-Band (upwards of 30GHz). X-band frequencies having a large wavelength – 30mm can be helpful in detecting high altitude ice clouds, heavy rains occurring anywhere under 250 to 300km radius, thunderstorms, and various other weather phenomenons. Whereas, the Ka-band frequencies have a wavelength much smaller – 8.4mm. Smaller the wavelength, the less distance wave can travel but there is an advantage of being able to view more details in the cloud formation process that large wavelength X-band frequencies cannot.
The science behind weather radars is tremendous and we will keep that for some other time. It will be more interesting to watch the actual radar in the pictures below.
The X-band cloud radar can scan the atmosphere up to 250km and up to 300km on clear weather conditions. Being located near Mahabaleshwar, 300km range covers the city of Mumbai, unfortunately it cannot do so on days of thick cloud cover. Nevertheless, it is quite useful in studying the incoming monsoon winds from the Arabian sea.
The X-band cloud radar pumps a massive 200kW of power every pulse of 1 ms (can vary depending on the configuration).
Check out a few images of the real-time scan.
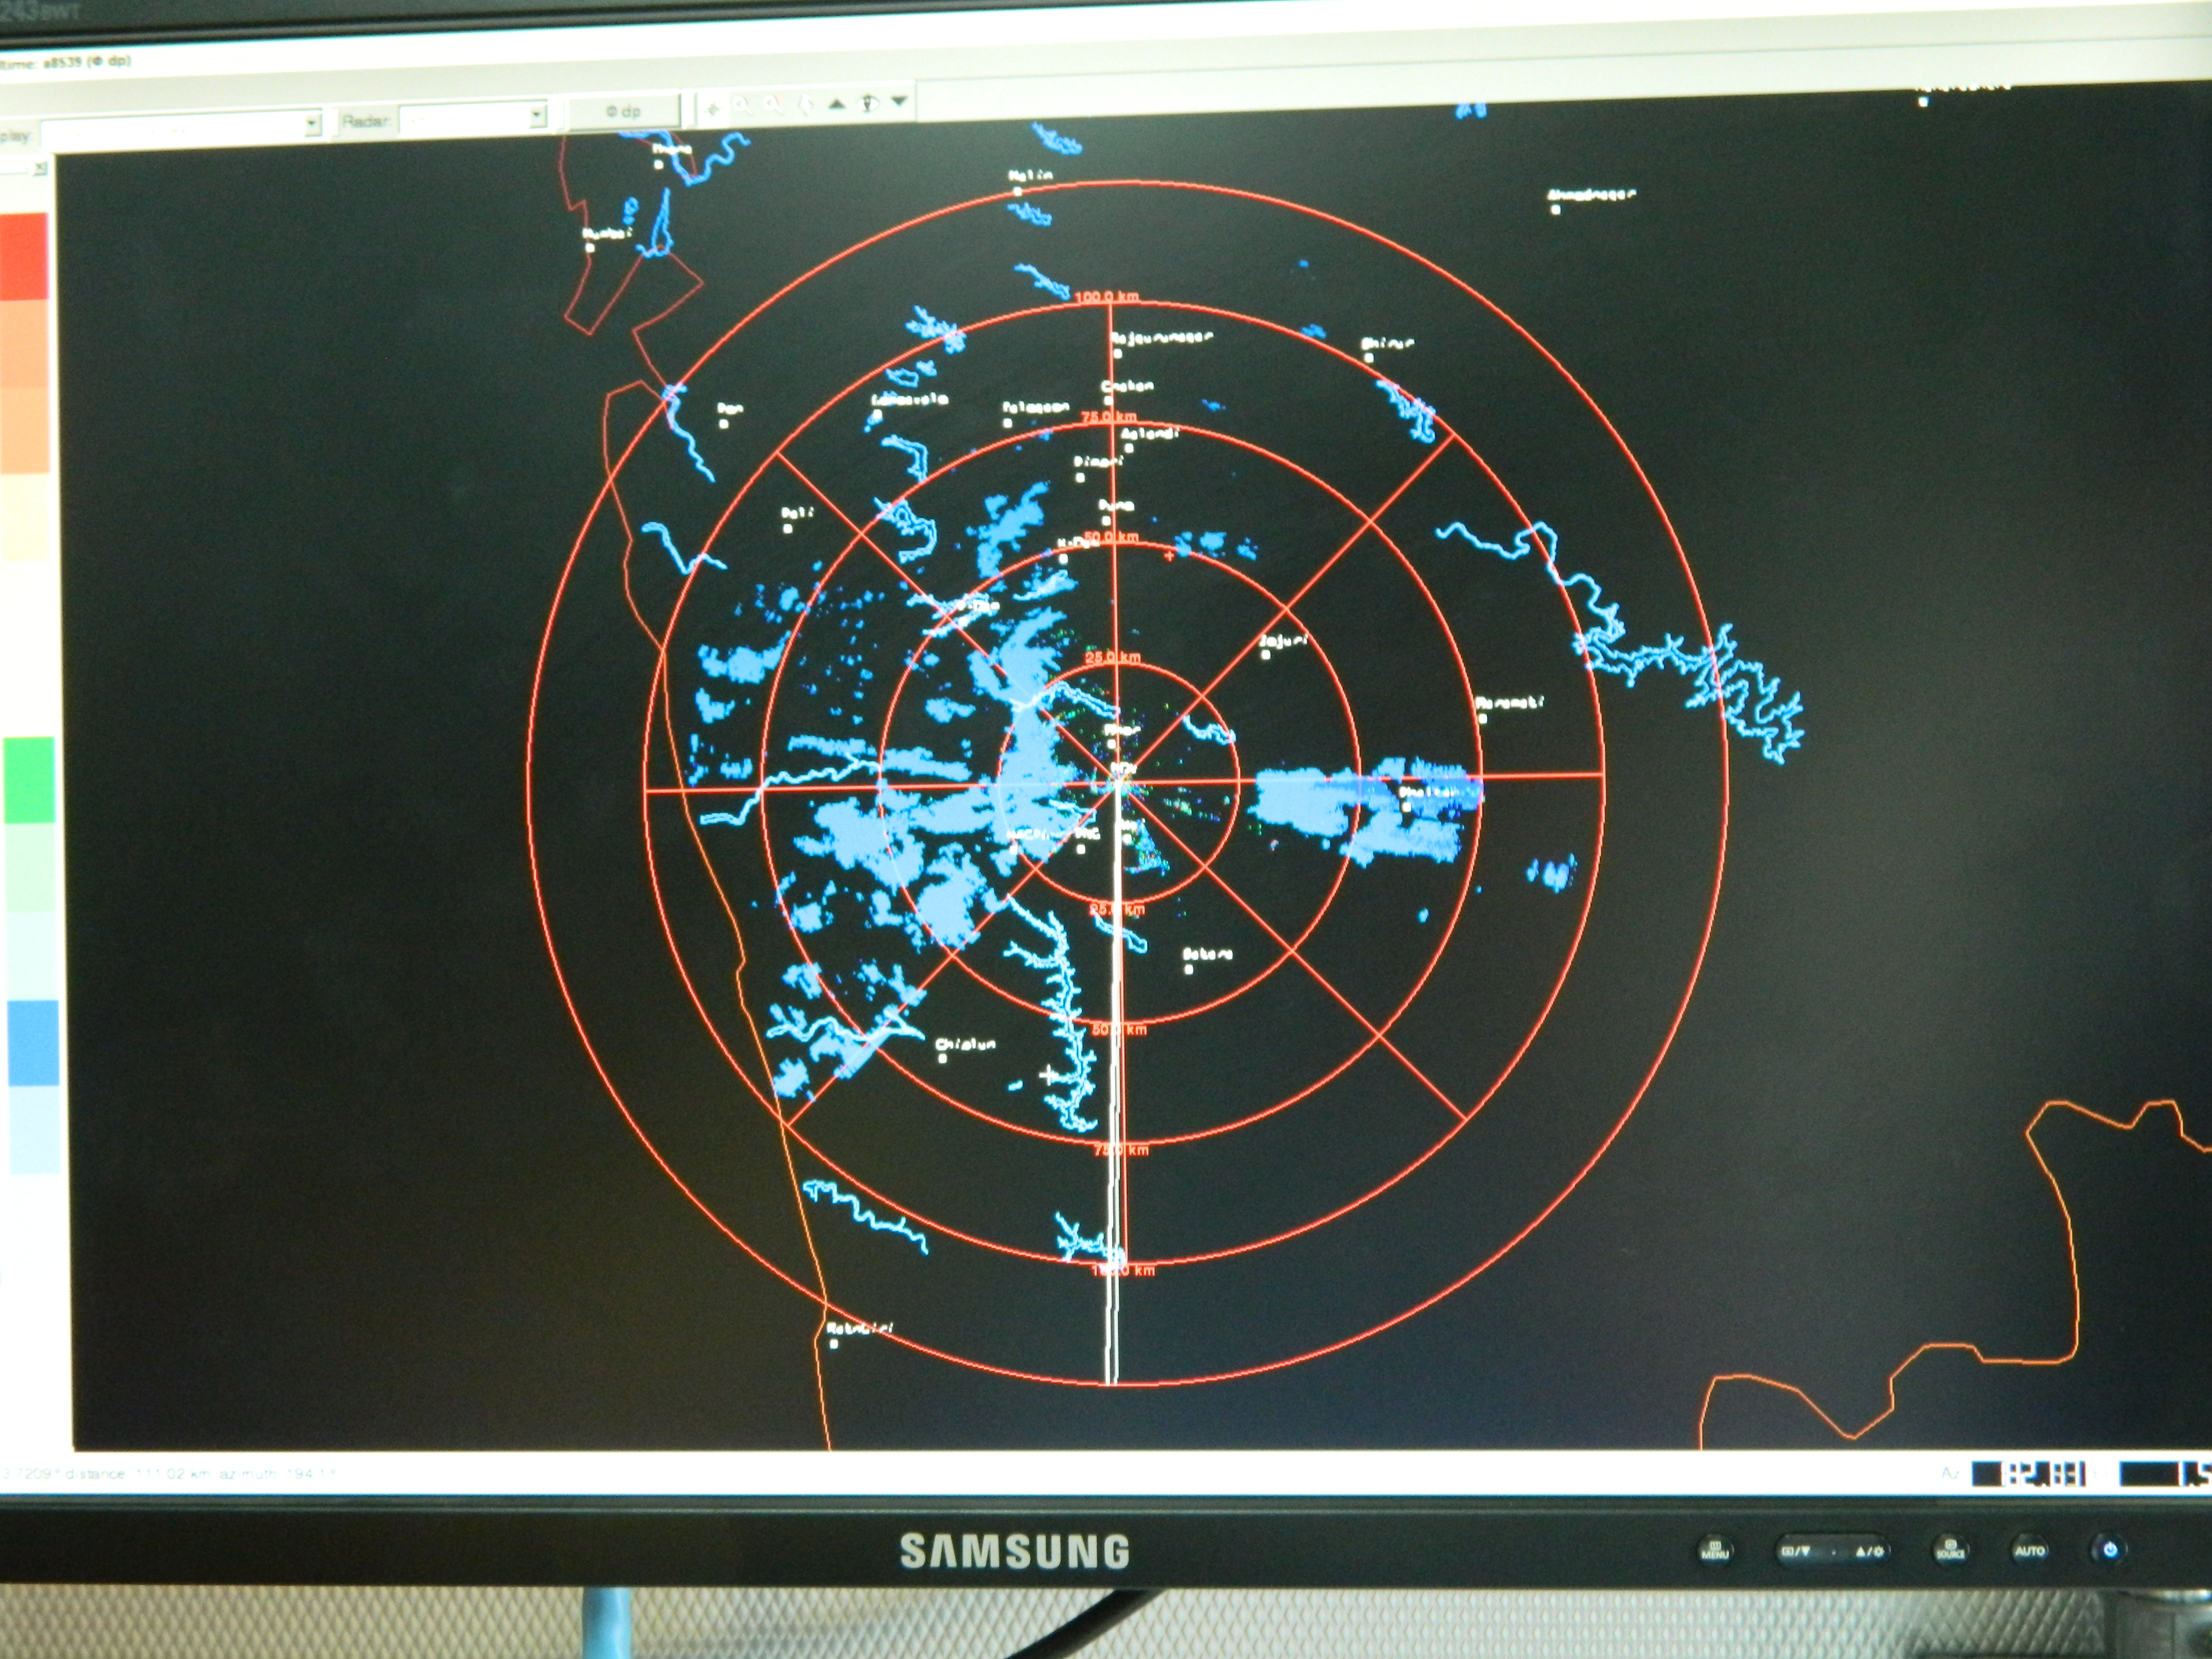
You can see a bunch of clouds in the image but they are all being lined up almost in a straight line. That is because the clouds are being blocked by the Western Ghats causing a rain shadow region towards the east. The alignment of the clouds in a straight pattern corresponds directly with the geographical structure of Western Ghats. The image above is a SNR plot or Signal to noise ratio plot. In simpler words, it shows which region has thicker clouds that are reflecting the transmitted pulse back.
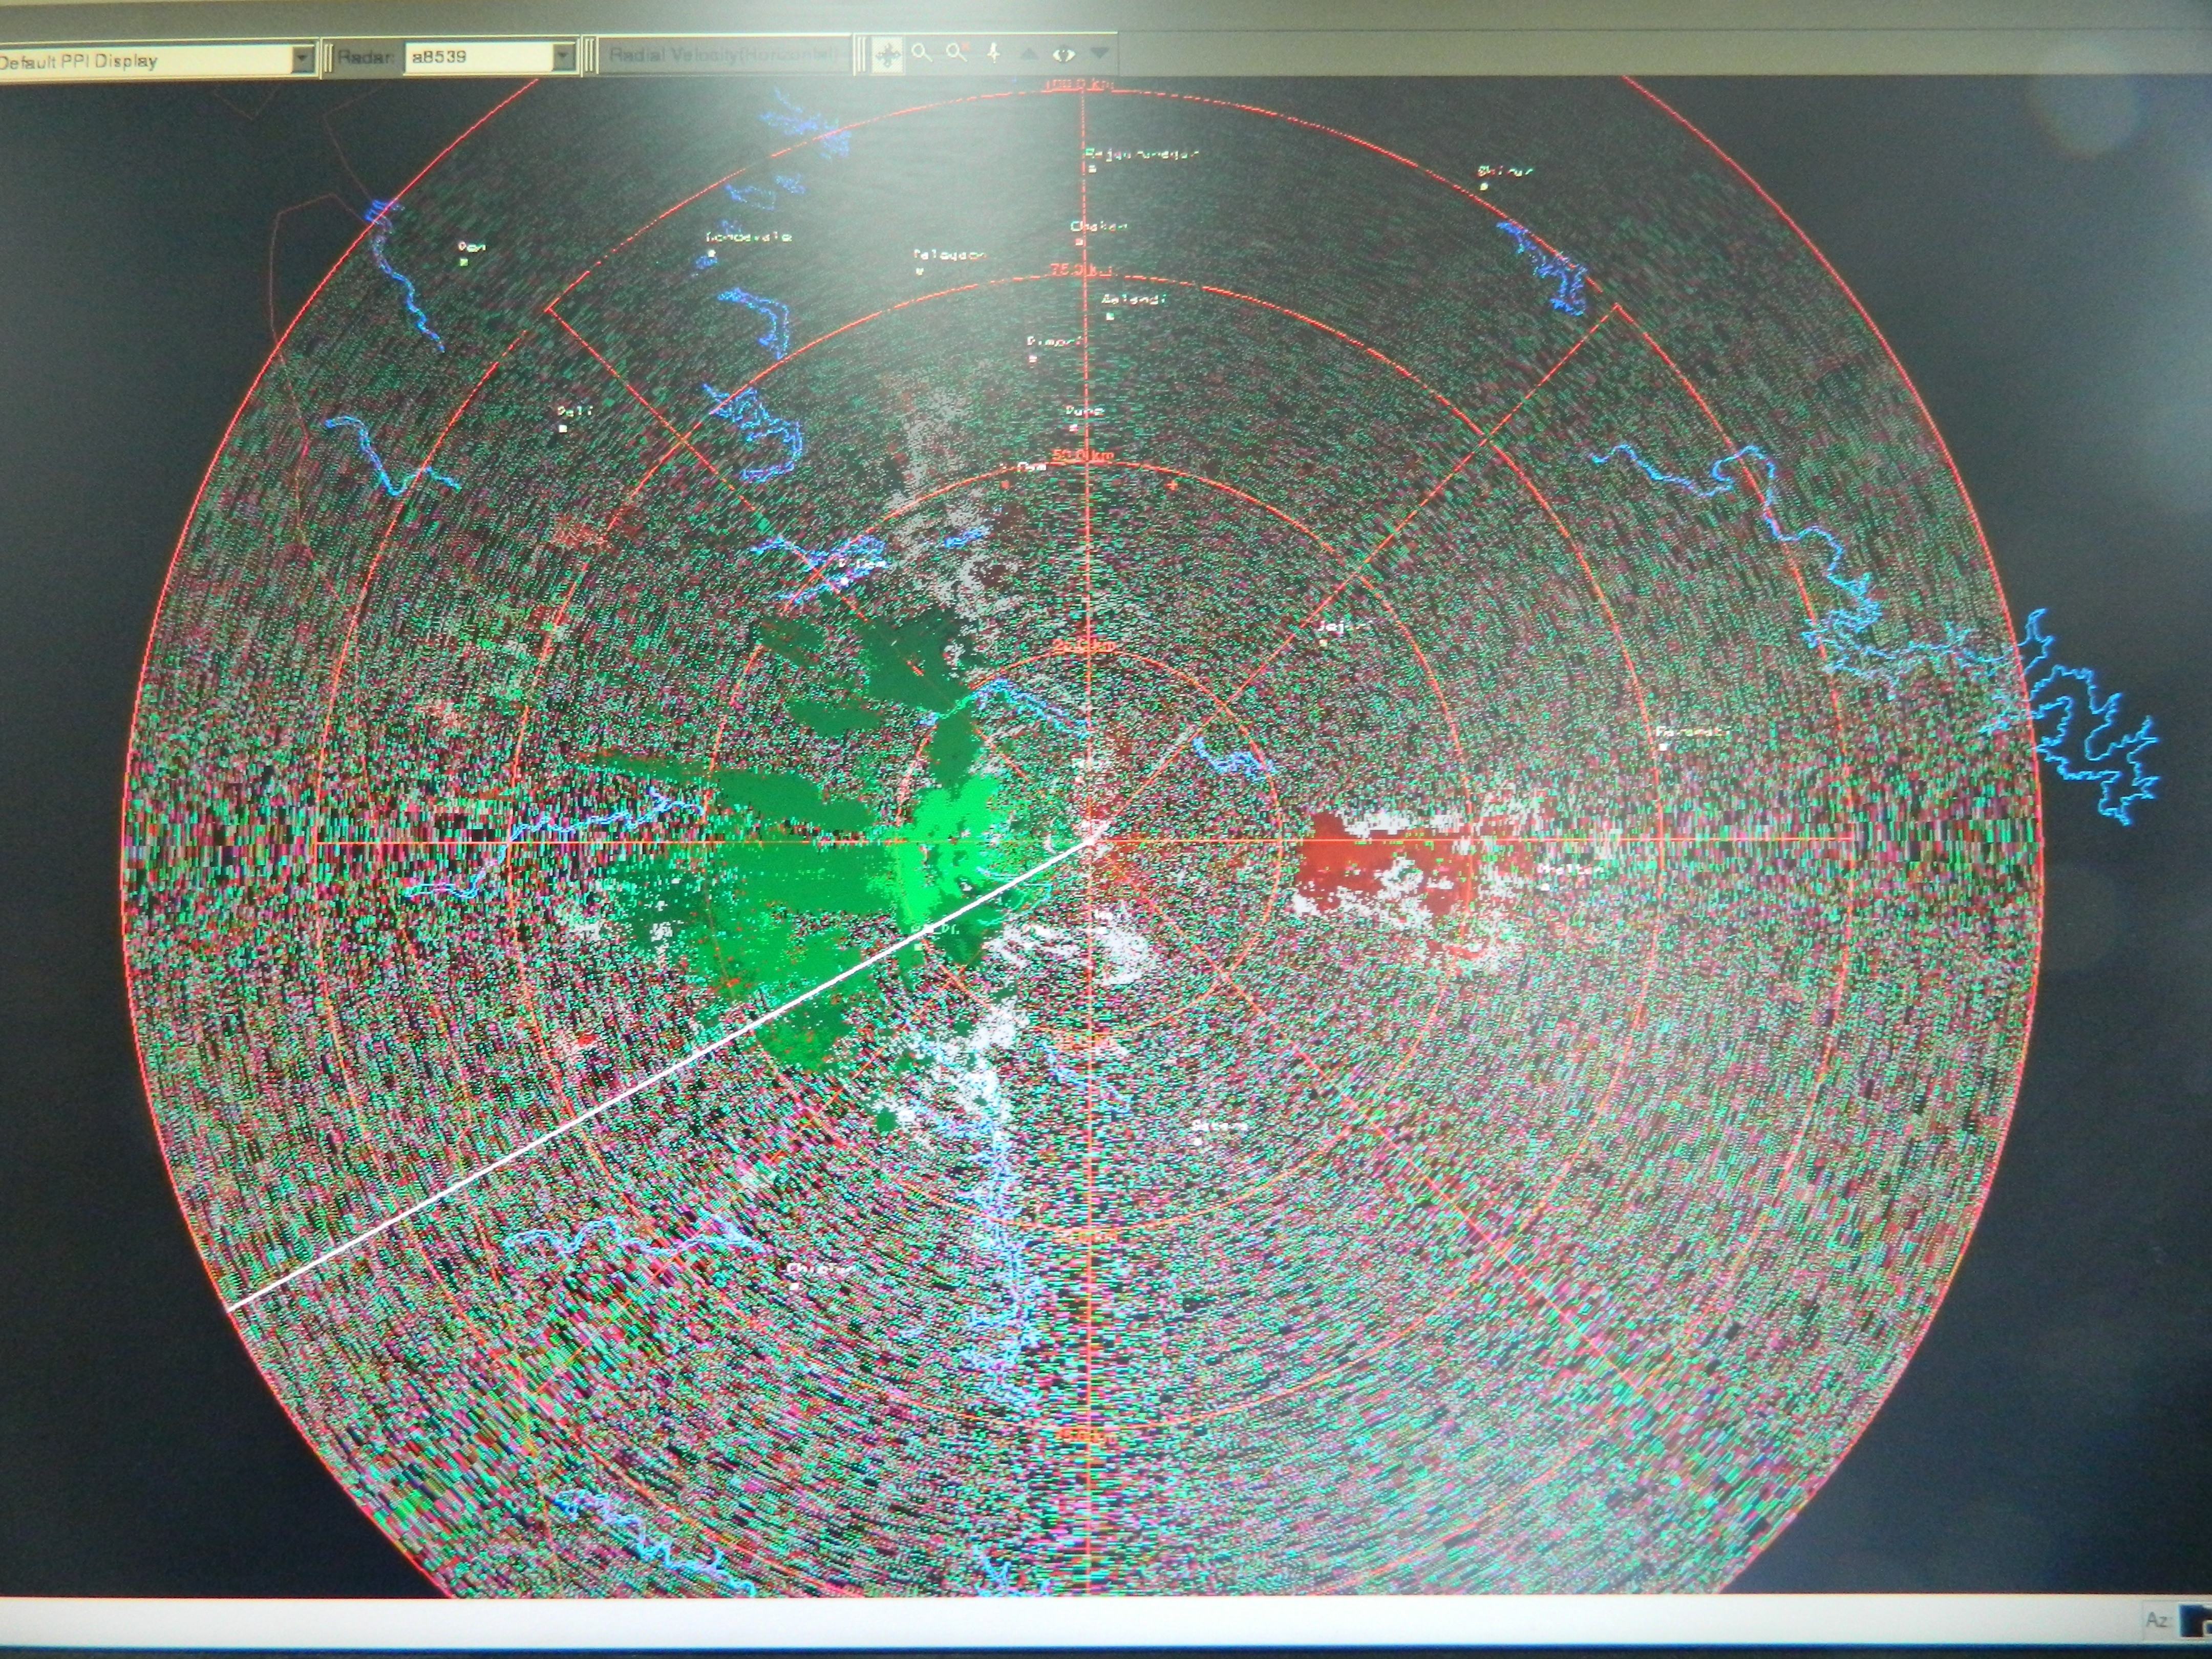
Because of doppler effect, we can see at what velocity the clouds are moving. The Green region shows a positive doppler velocity because, as the clouds move towards the radar the doppler frequency is positive, while moving away the doppler frequency becomes negative and that is indicated by red regions on the plot. We can clearly see the rain shadow region towards the left side of the image and also see the western ghats blocking most of the clouds coming inwards. There are in fact a lot more clouds that are invisible to X-band frequencies and that is all because of having a large wavelength.

Ka-band cloud radar was pumping about 1.8kW of power every 100 microseconds.
With a much smaller wavelength, Ka-band cloud radar can give us tremendous amount of details regarding the clouds. As you saw a doppler velocity plot above, I managed to get a doppler velocity plot obtained from this Ka-band cloud radar.
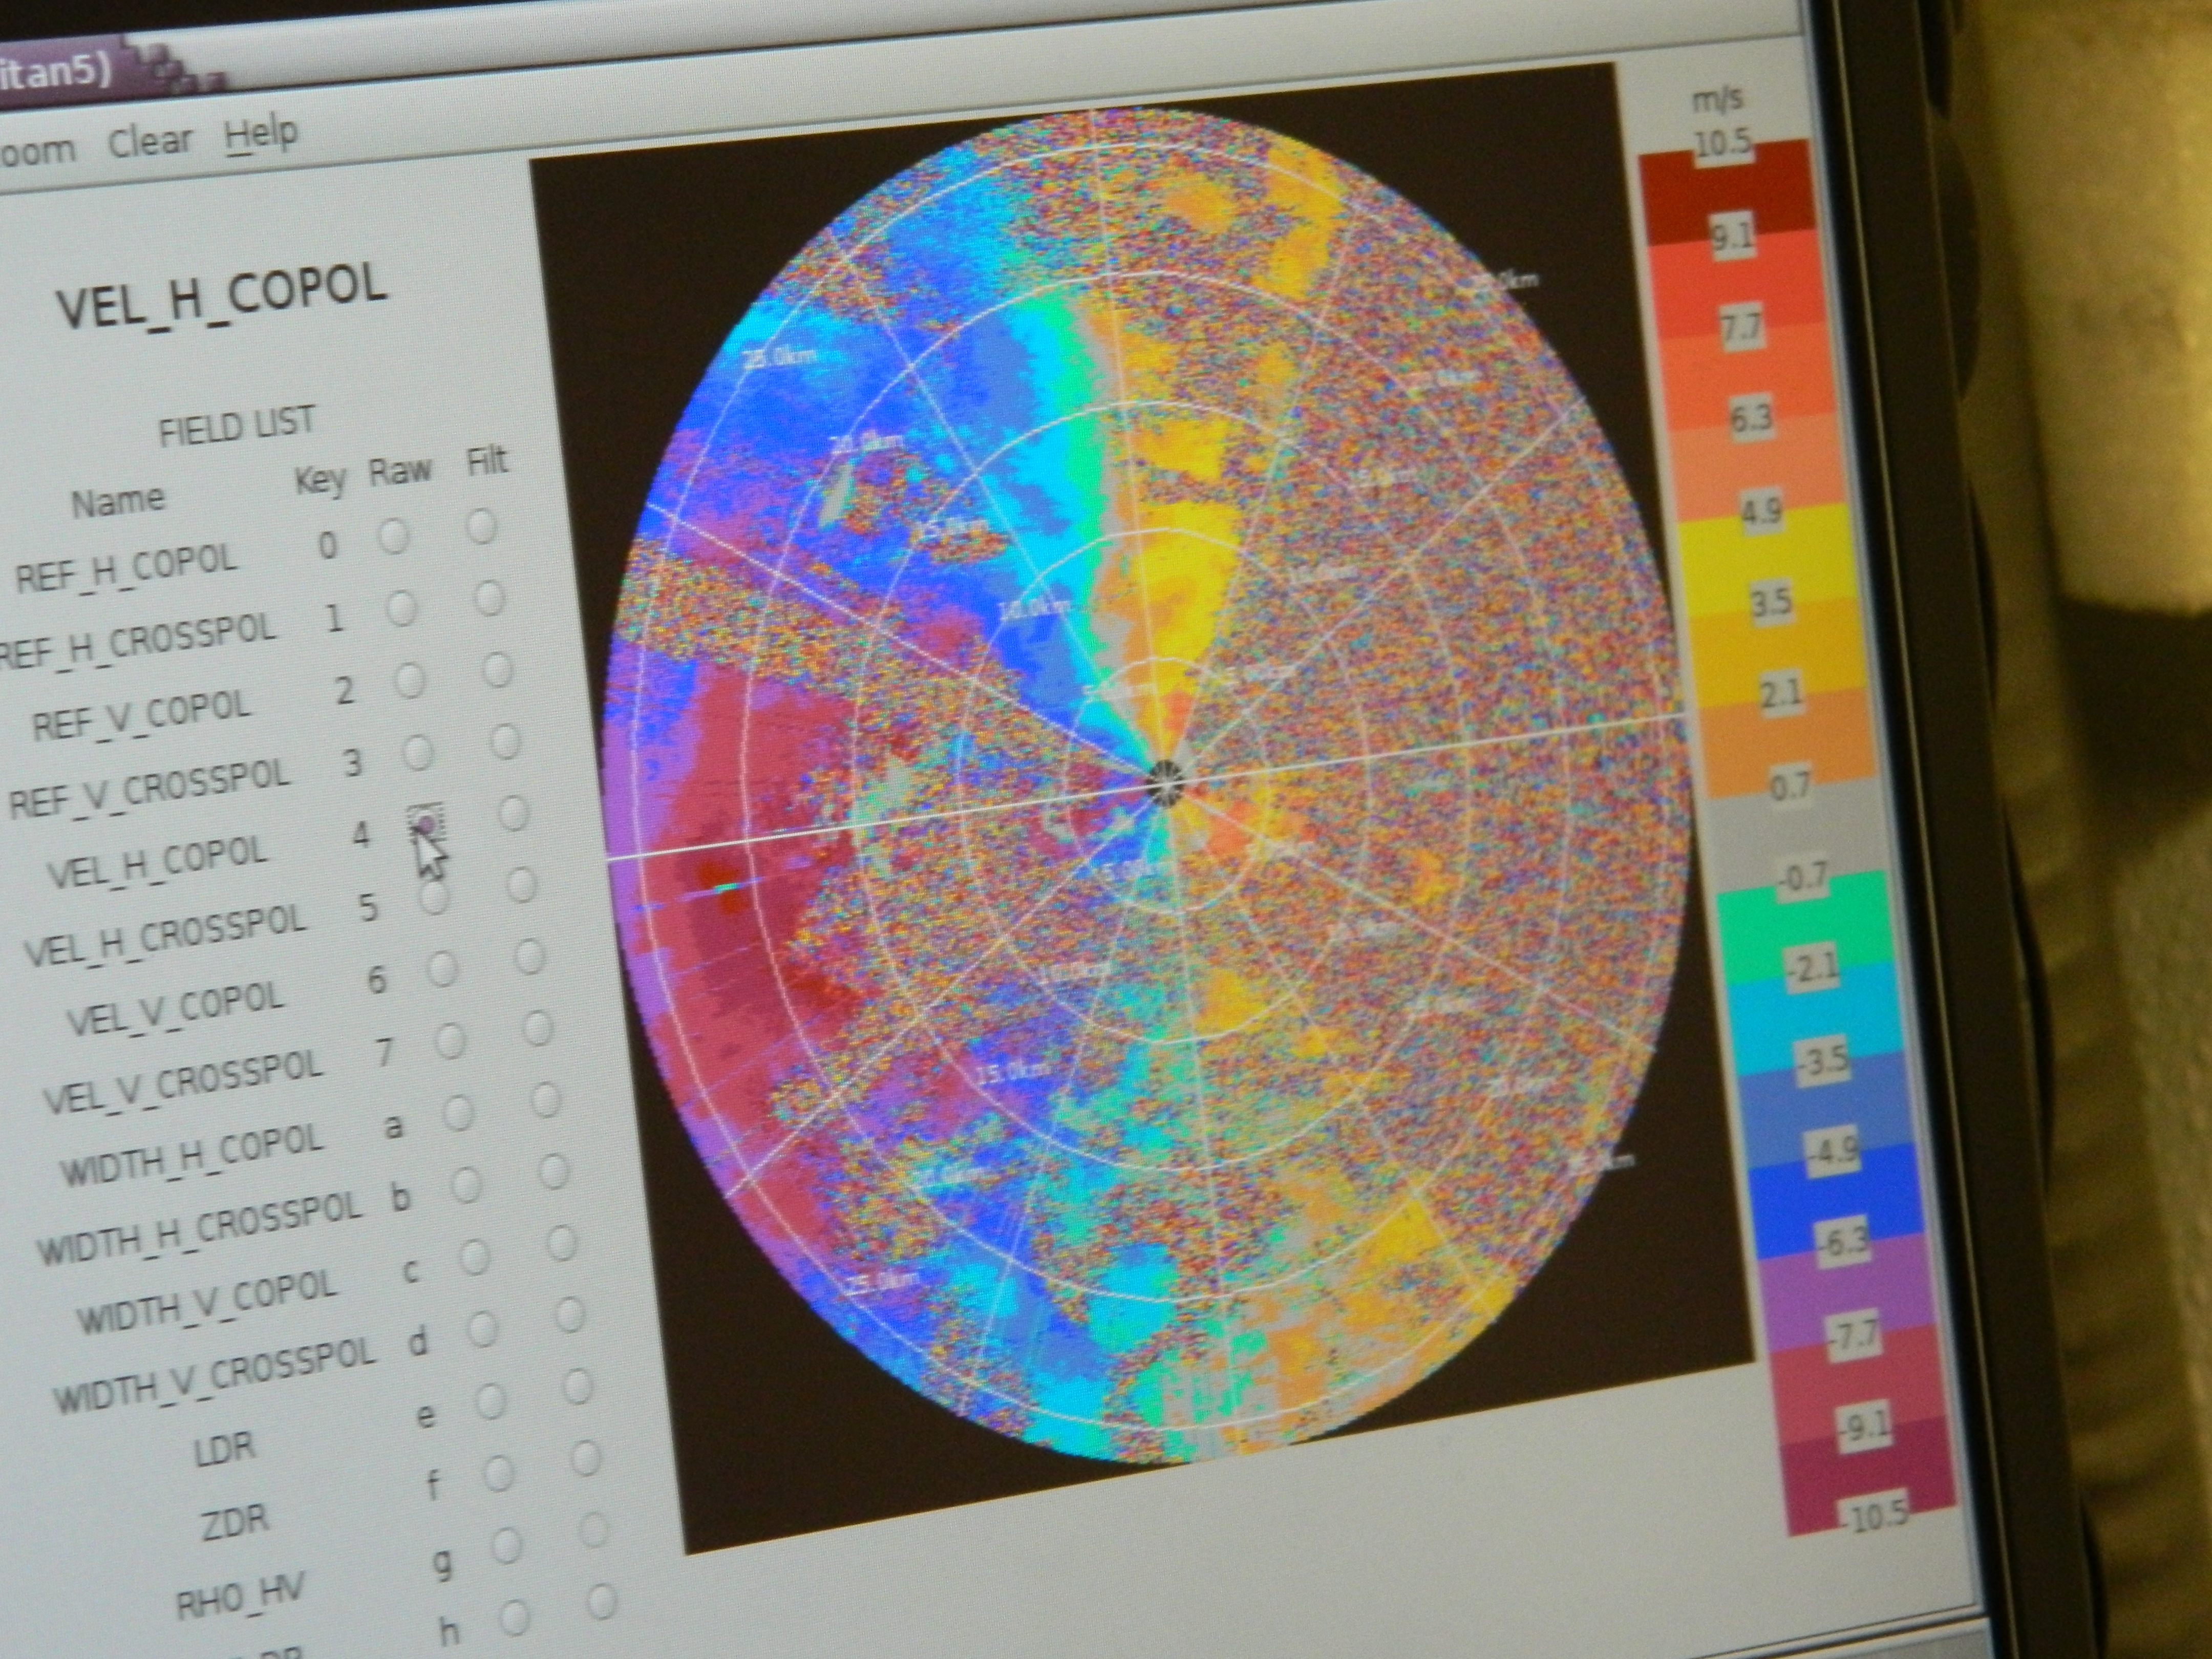
Simply look at the amount of detail it is able to show.
The high resolution cloud radar images help in understanding the formation of clouds and its life cycle. Combining the result of X-band for a long range visibility and Ka-band’s high resolution scans, do add in to the understanding of weather mechanics, especially during monsoon.
There are a huge number of plots and analysis that can be obtained from these radars. Keeping the Ka-band radar in vertical scan mode during light rains will give you a visibility of ice crystals in the 4 to 5km range melting and falling down in the form of rain.
At times, the ice crystals melt and keep falling to a certain level but then are lifted back into the icy region because of warm air blowing upwards.
Central database and weather prediction models
Many of us underestimate the capabilities India has. IMD and ISRO, together make use of the national radar network and weather stations situated across the nation and acquire the data remotely every few hours. The data is then fed into massive super computers running weather prediction algorithms. After 3 hours or so of number crunching, the algorithm spits out the prediction that goes straight on to the IMD’s website as public domain knowledge. Apparently, all we do is scream at IMD for making wrong predictions about a highly unpredictable and complex weather system in the world – Indian monsoon.
If you think making predictions is so easy, go ahead and read the weather data (it is public domain knowledge anyway) and make predictions yourself, plus you can add impart some new knowledge in yourself in the process.
Resources that you might want to have a look:
Indian weather radars and products
Operational Numerical Weather Prediction (NWP) System of IMD
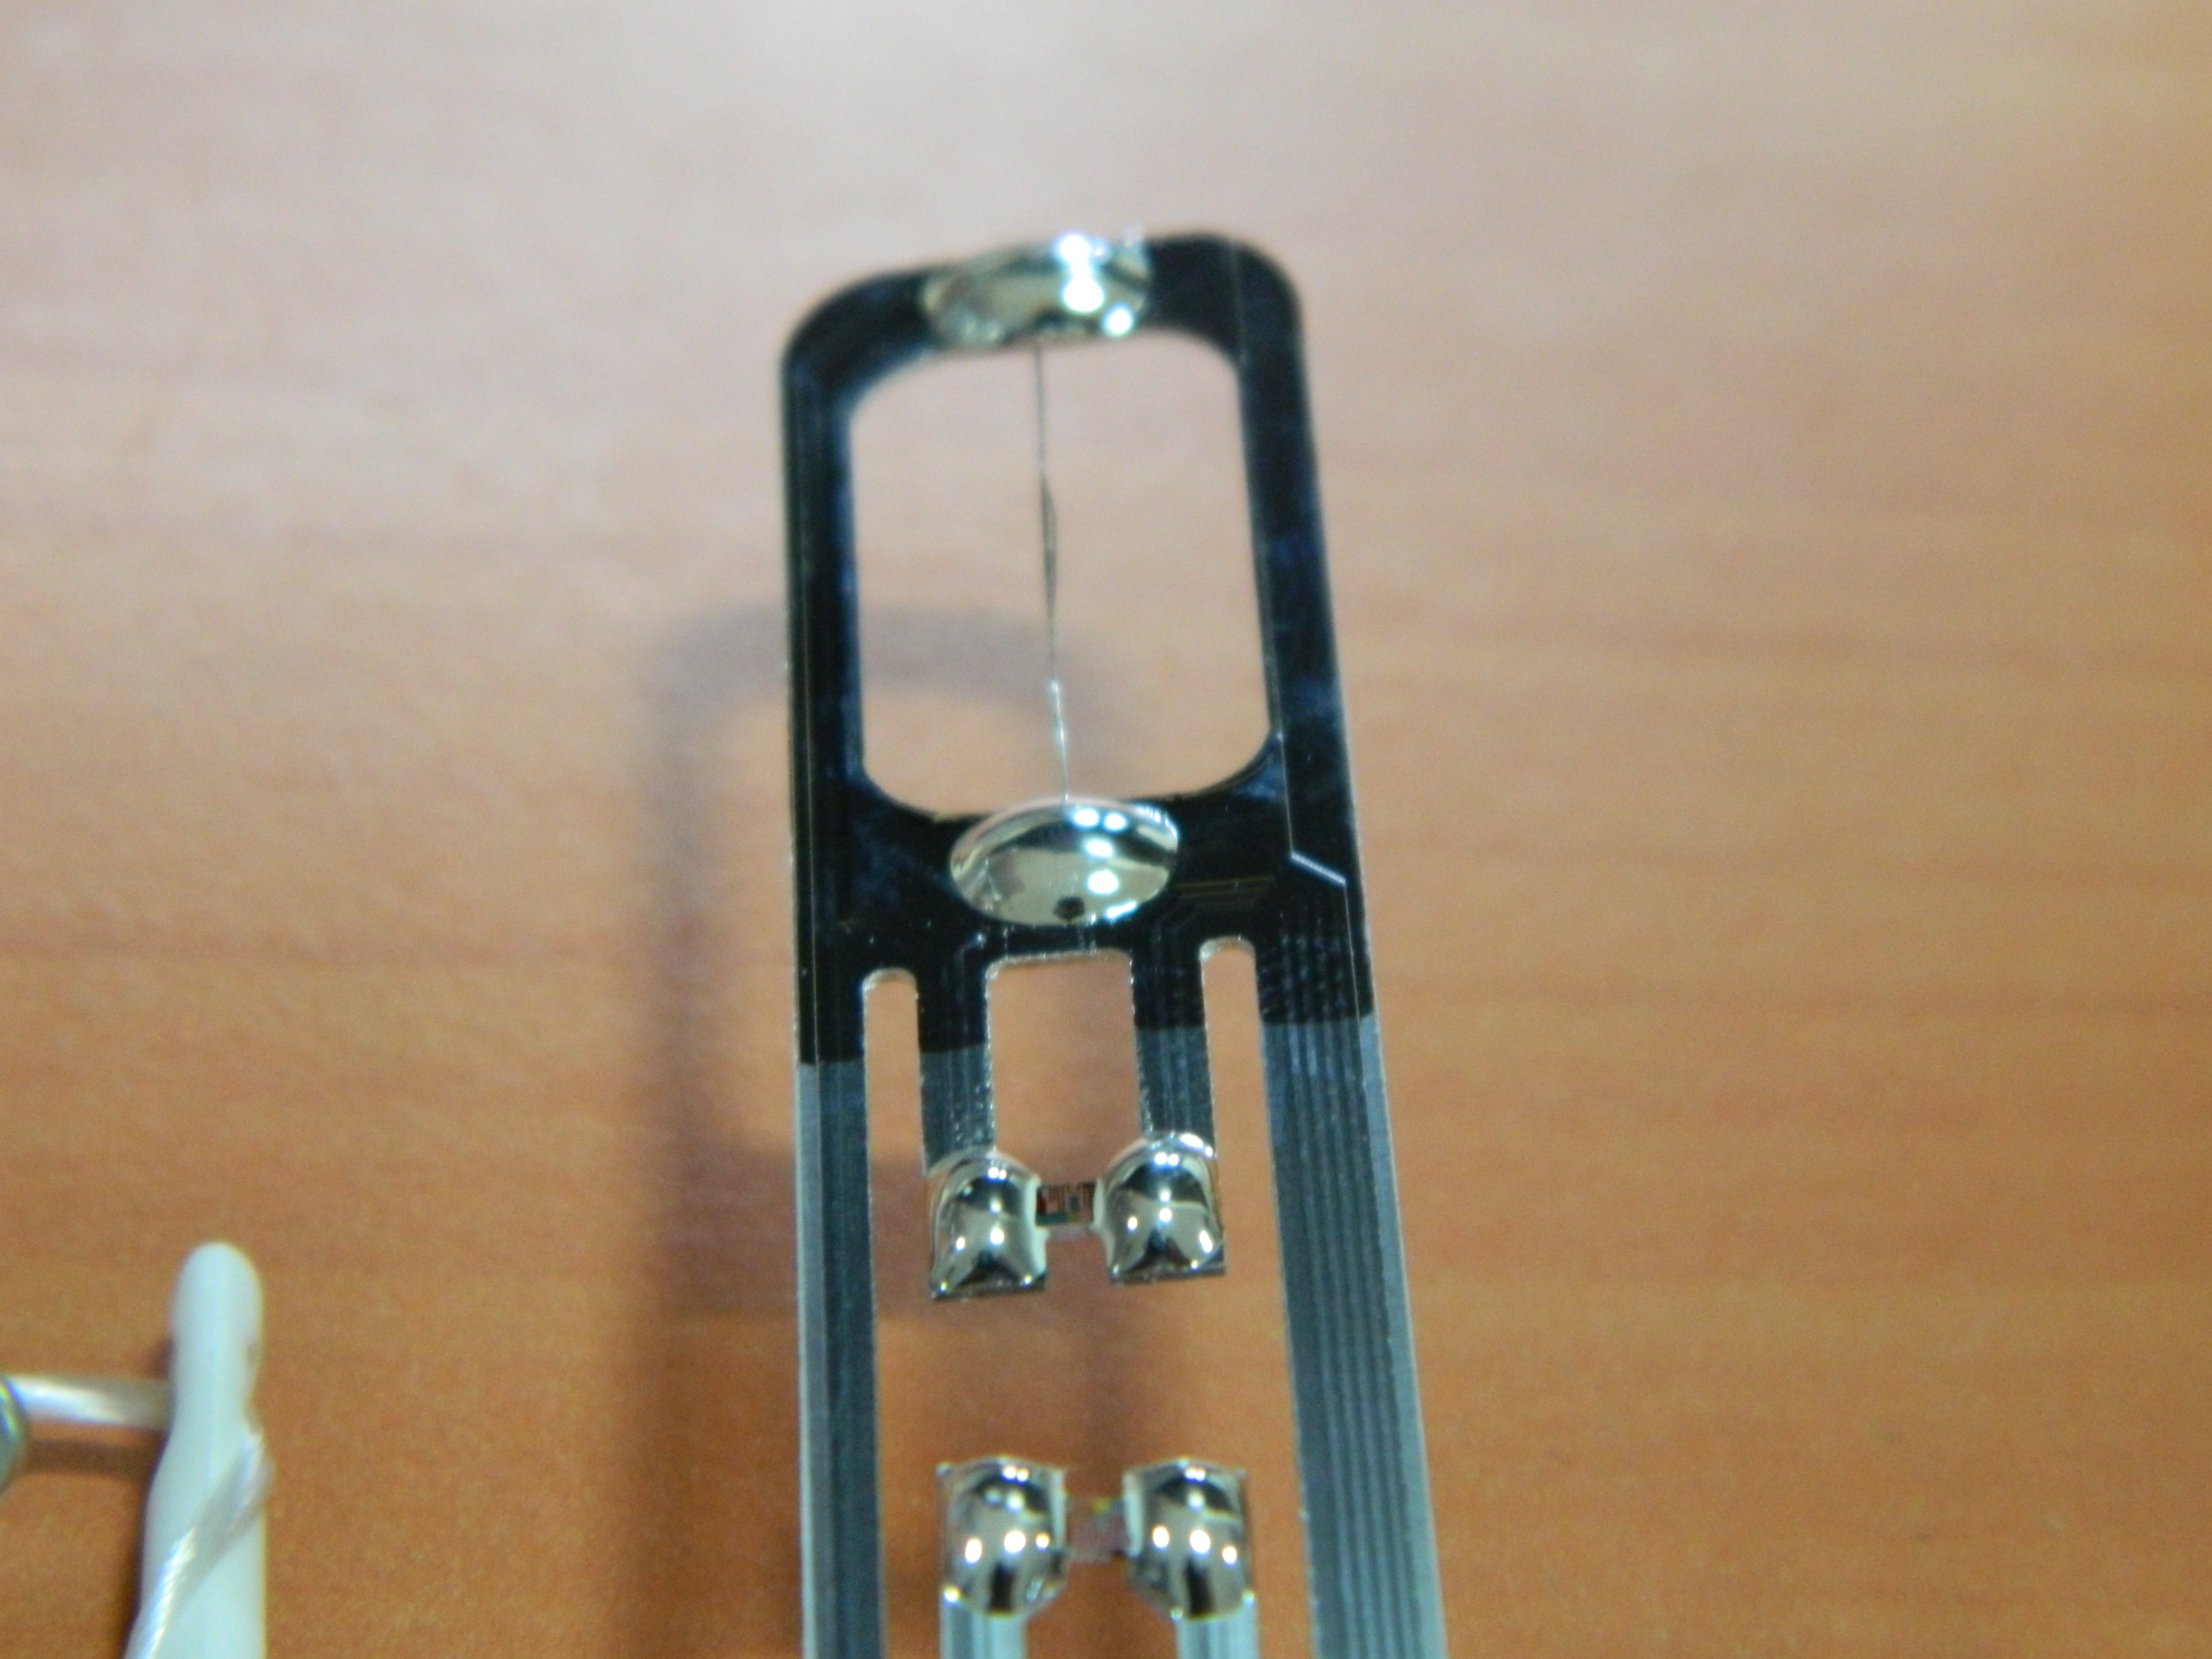
In another laboratory situated on a mountain opposite to the one where these radars were installed, they do all sort of atmospheric research everyday. The workplace is very chill and environment is amazing. Twice everyday, radiosonde are launched attached to a large hydrogen balloon. Unfortunately, I happened to reach there just few minutes after they launched the first radiosonde of the day and in no time it had gone above the cloud cover. It relays weather data along with GPS coordinates back to the research facility every few seconds.

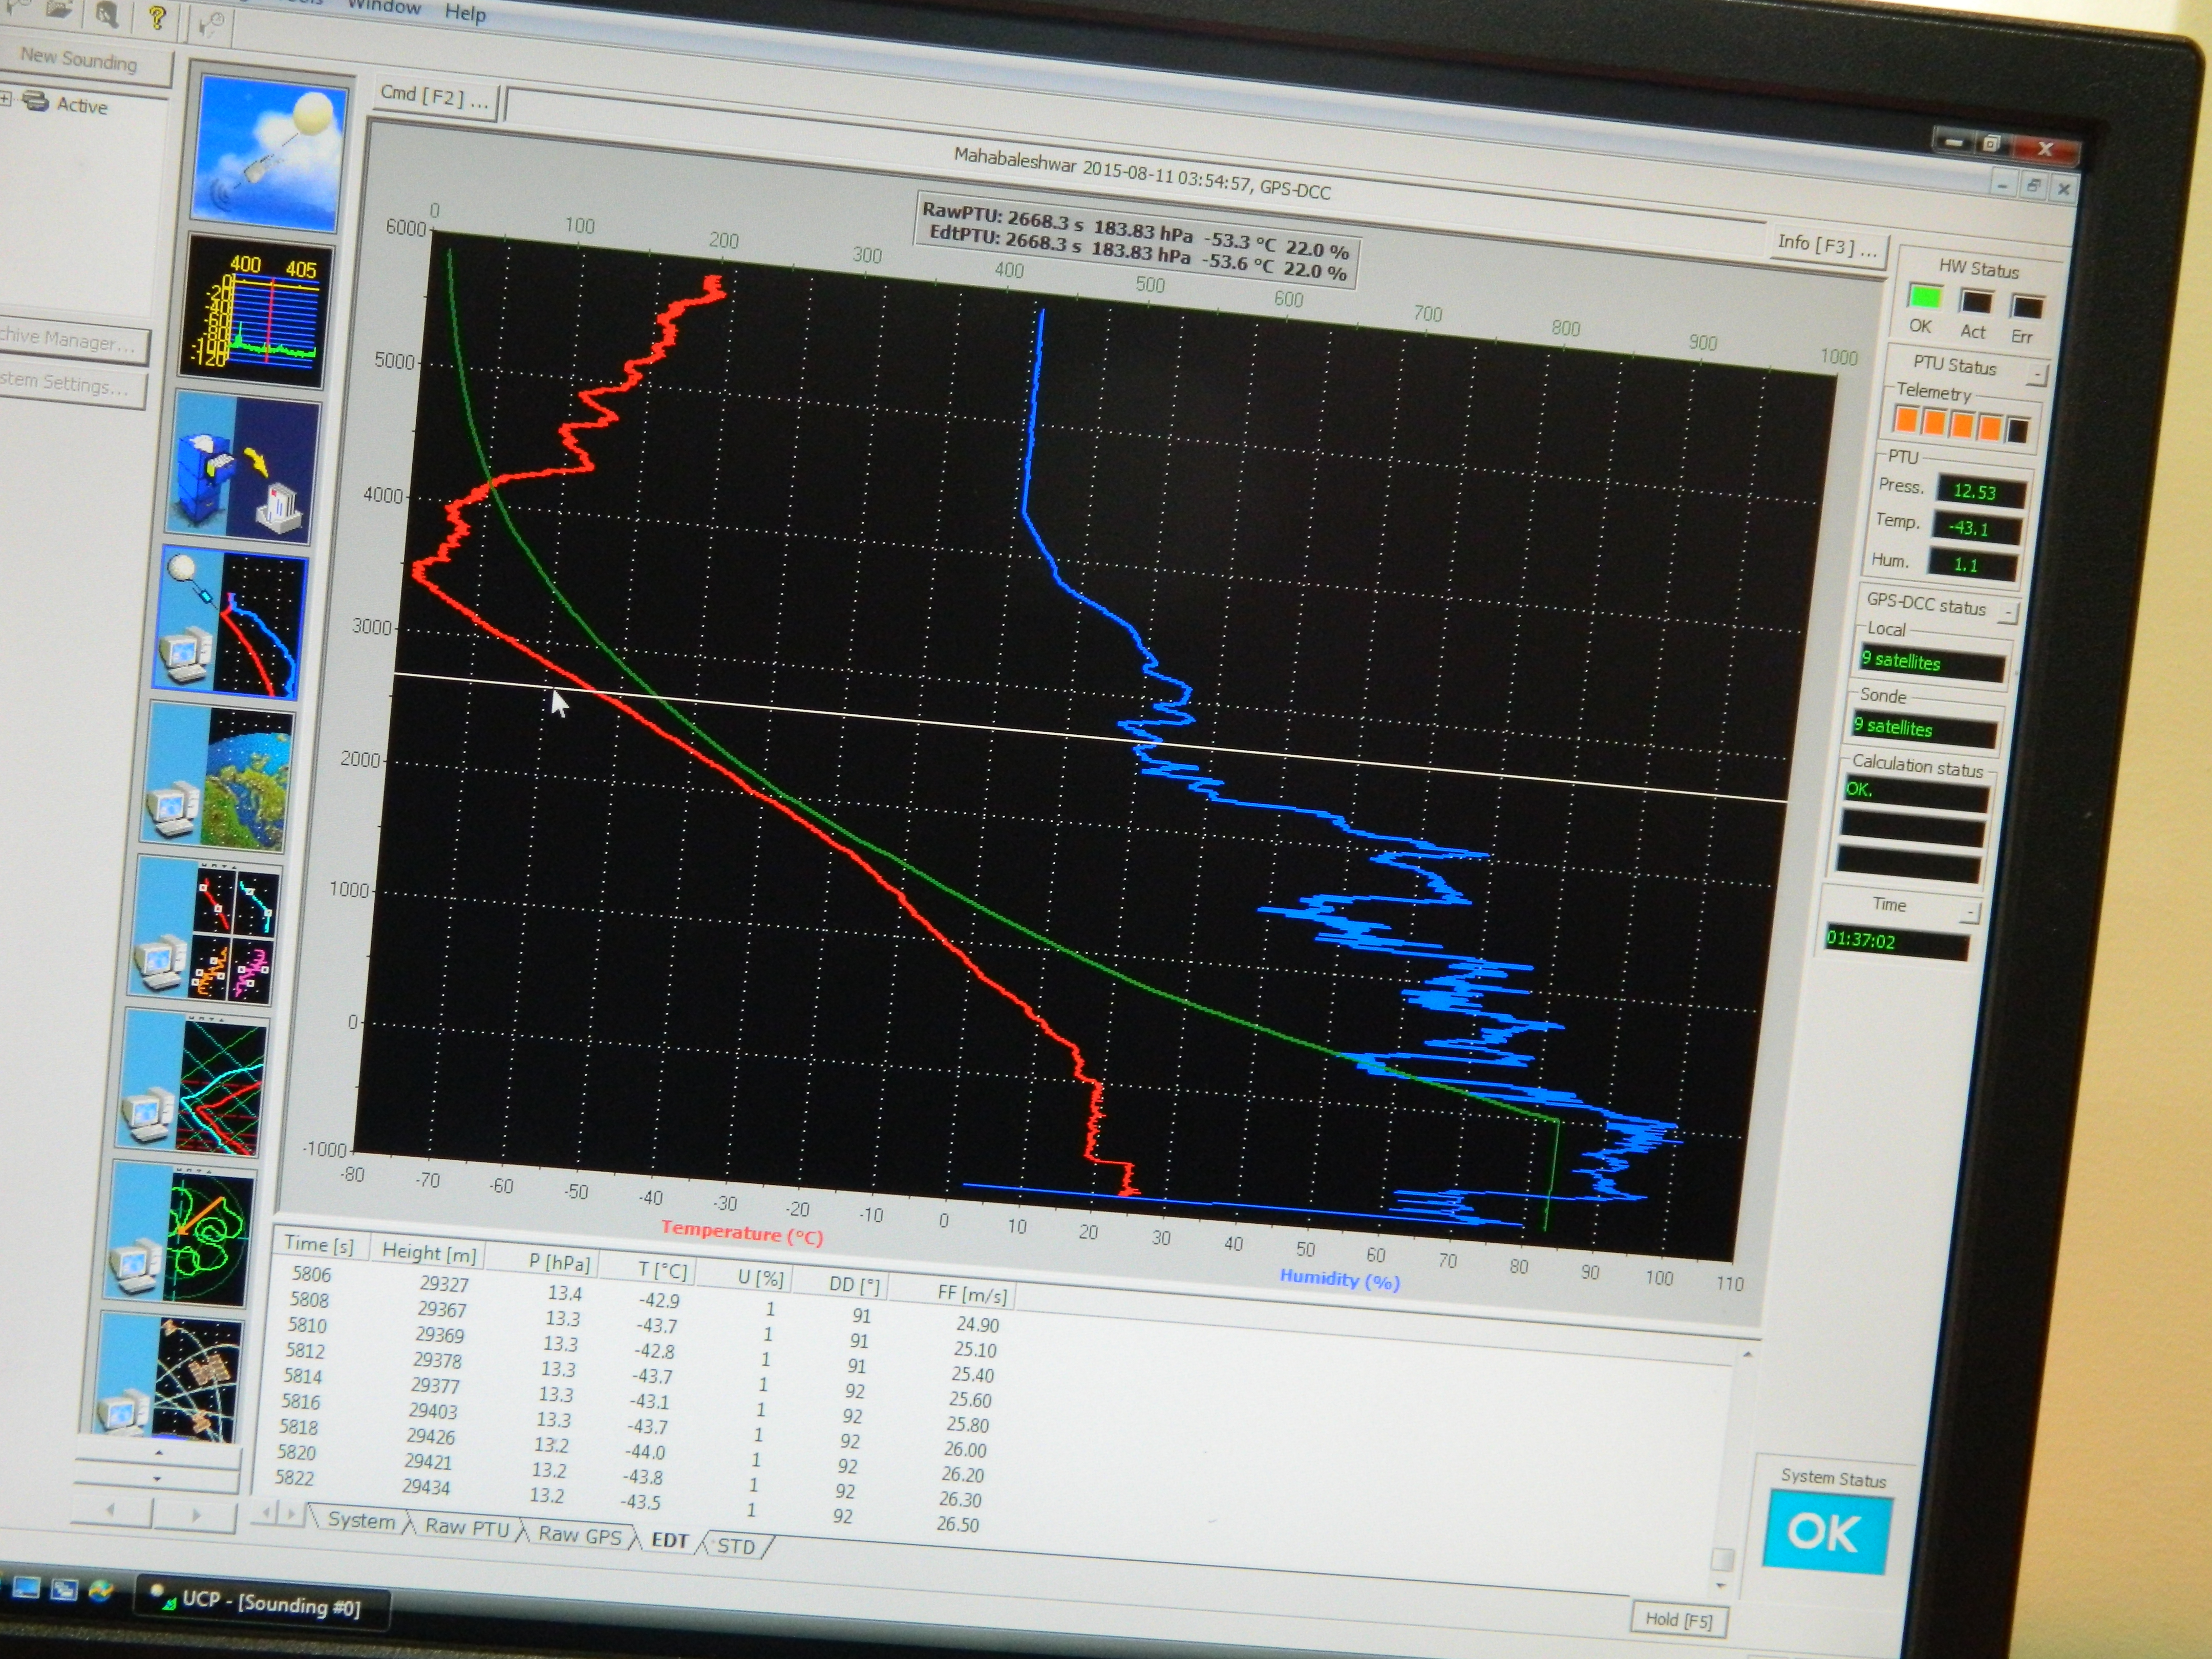
As the height changes, so does the temperature and humidity. After approximately 27 to 28km the humidity drops to near zero and in that region no clouds can form. This data is quite useful in studying the various wind patterns that flow at different heights giving a sense of having distinct layers in the atmosphere. I can vomit a load of science on this matter but I resist doing so at this time.
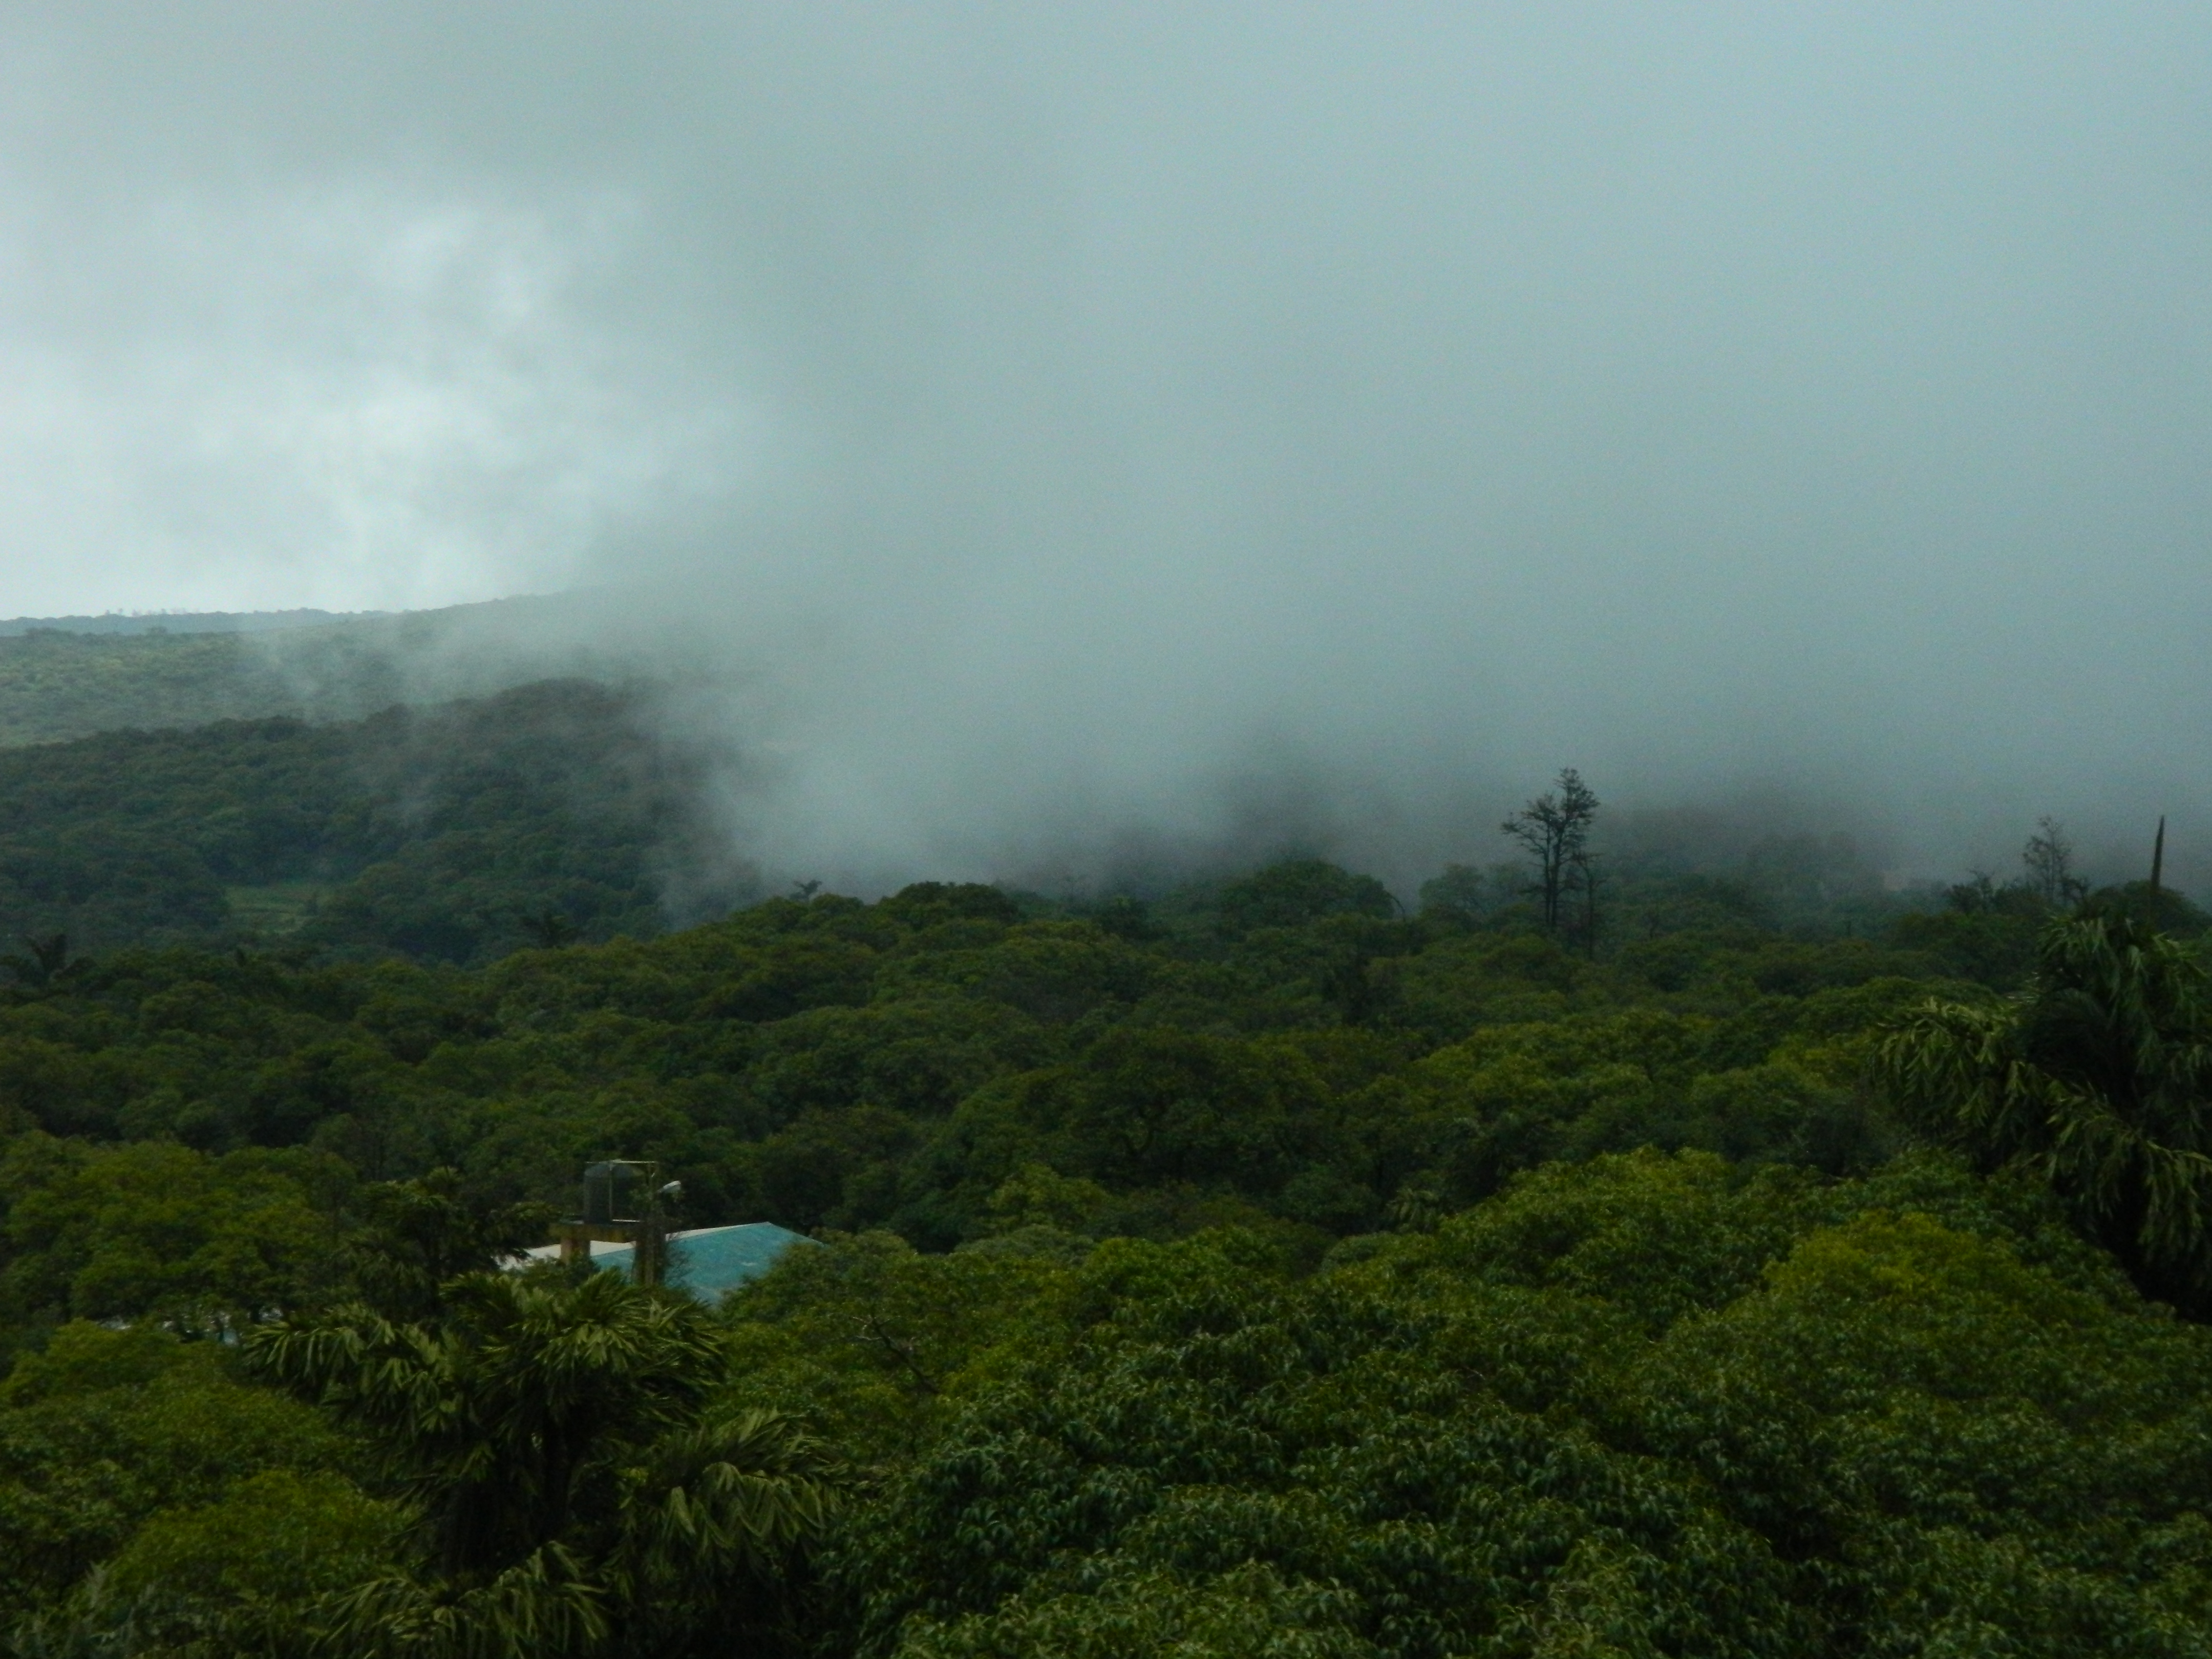
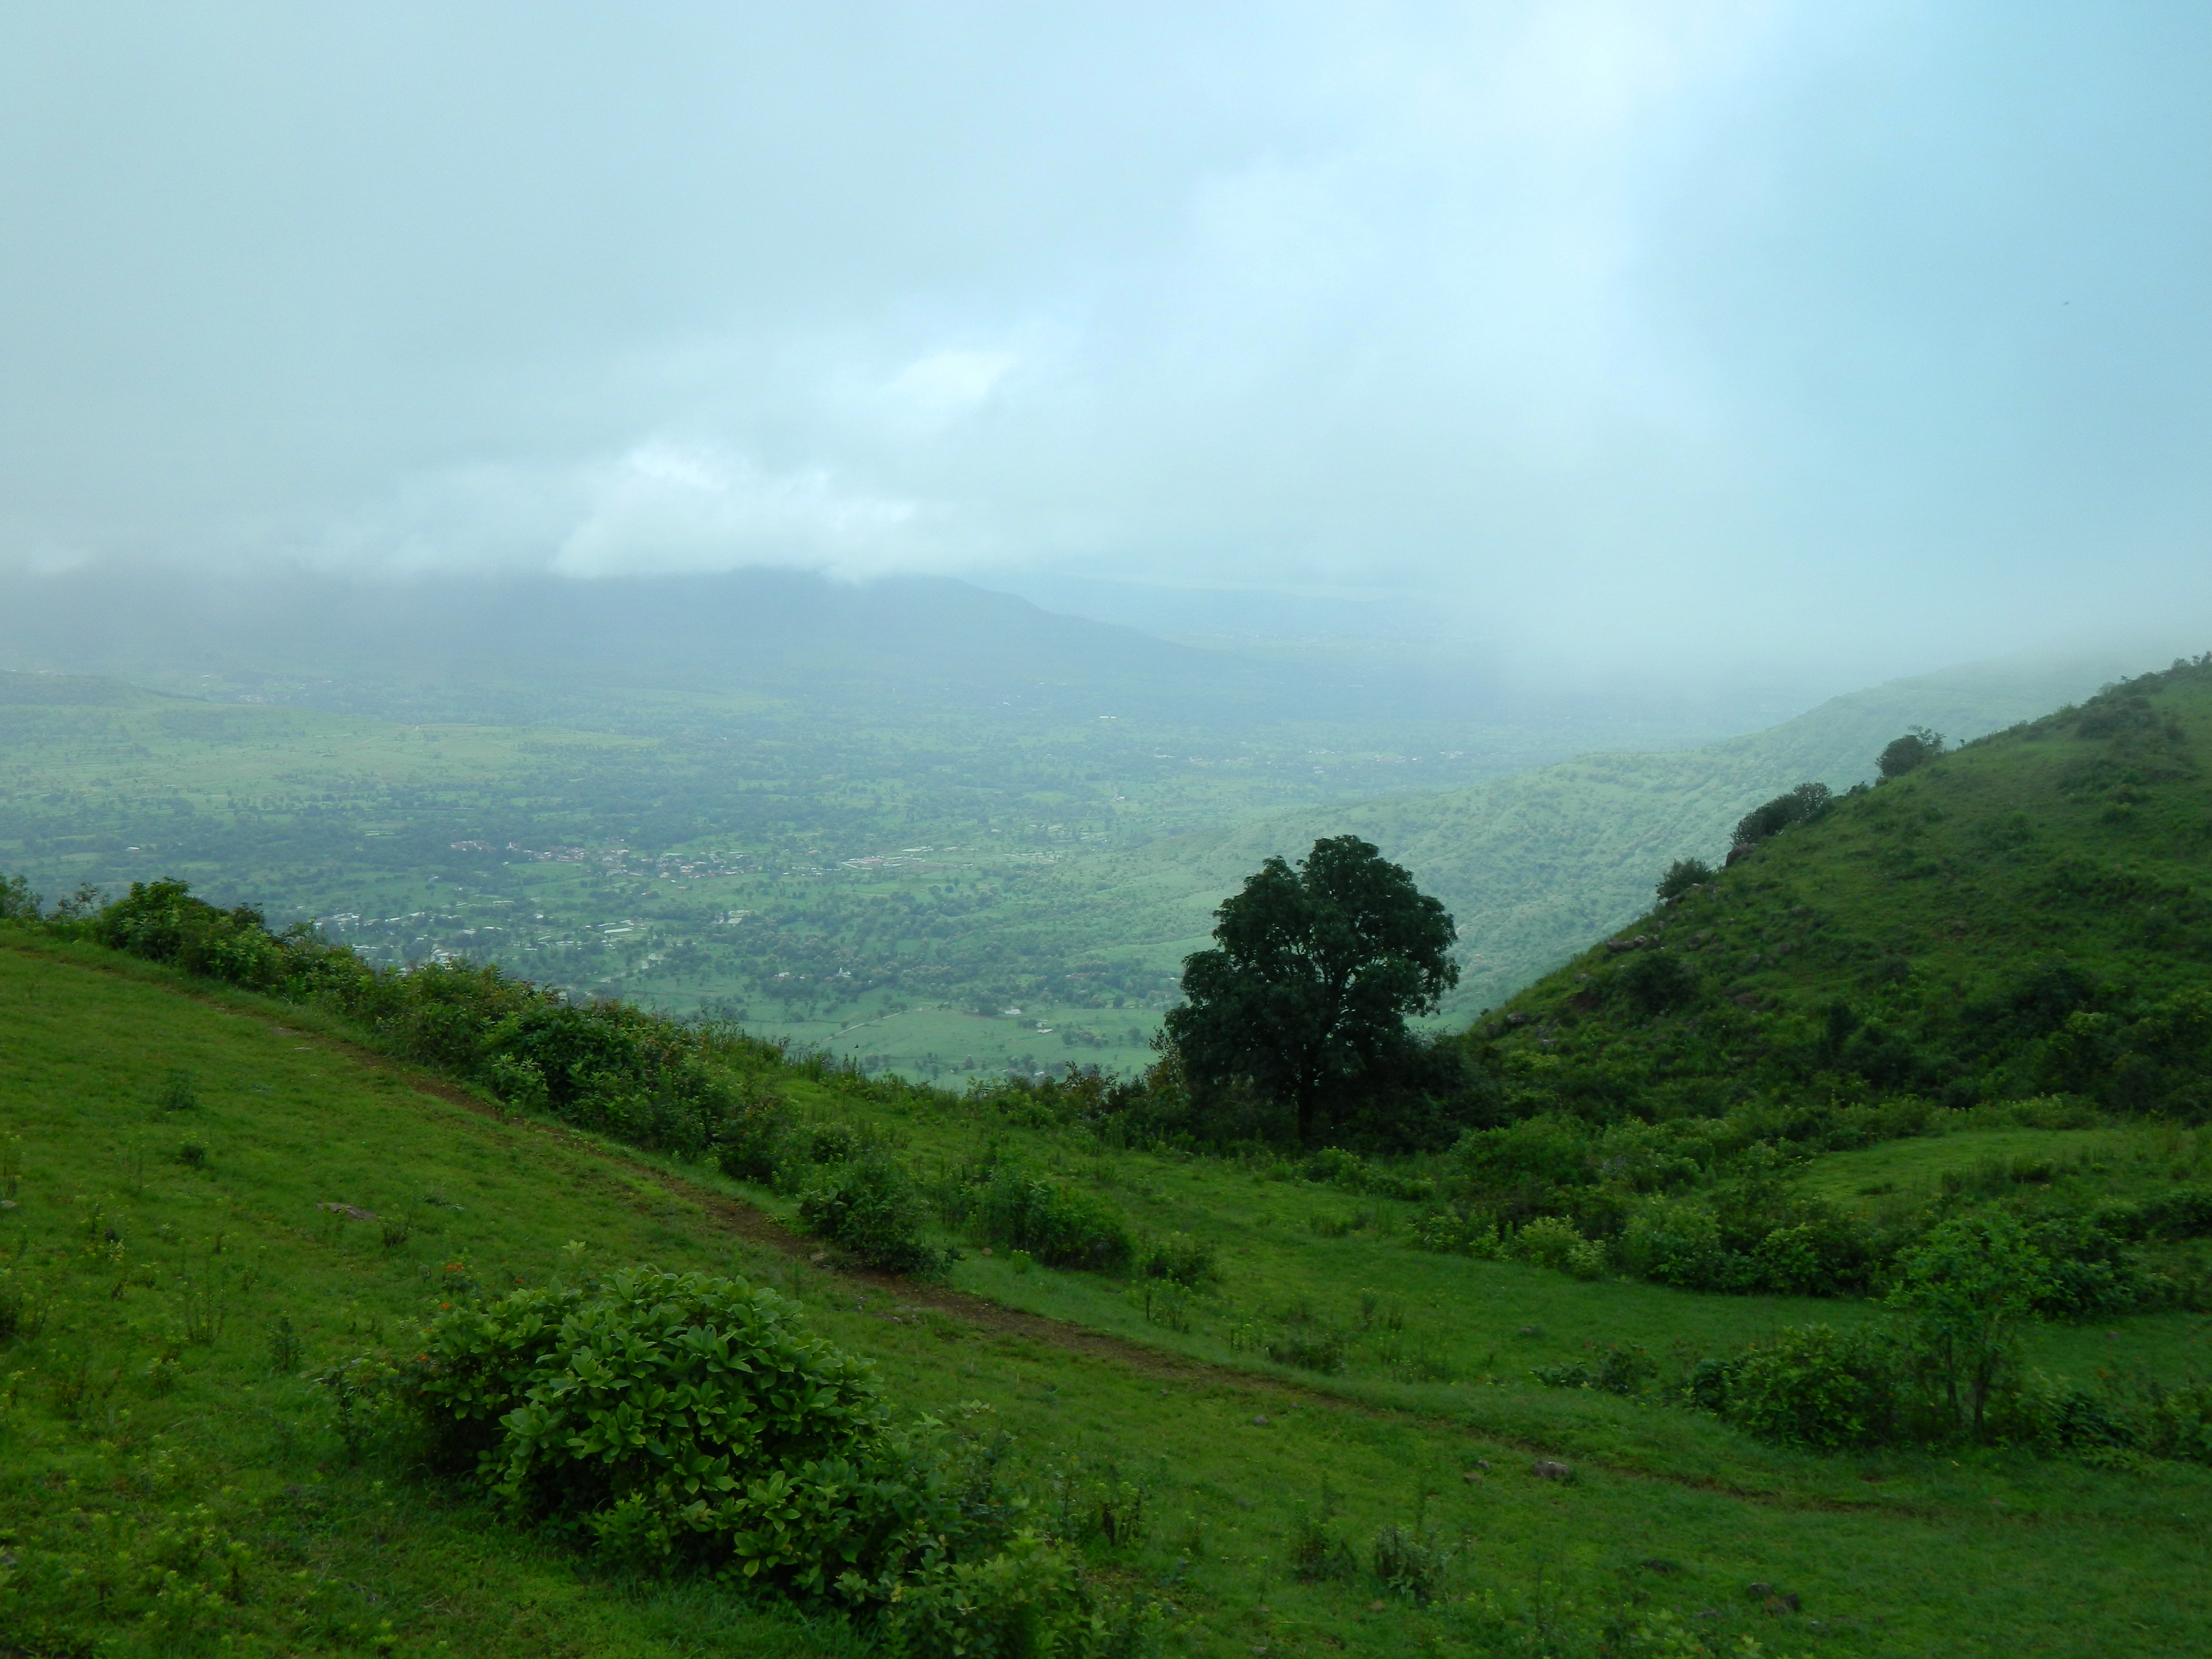
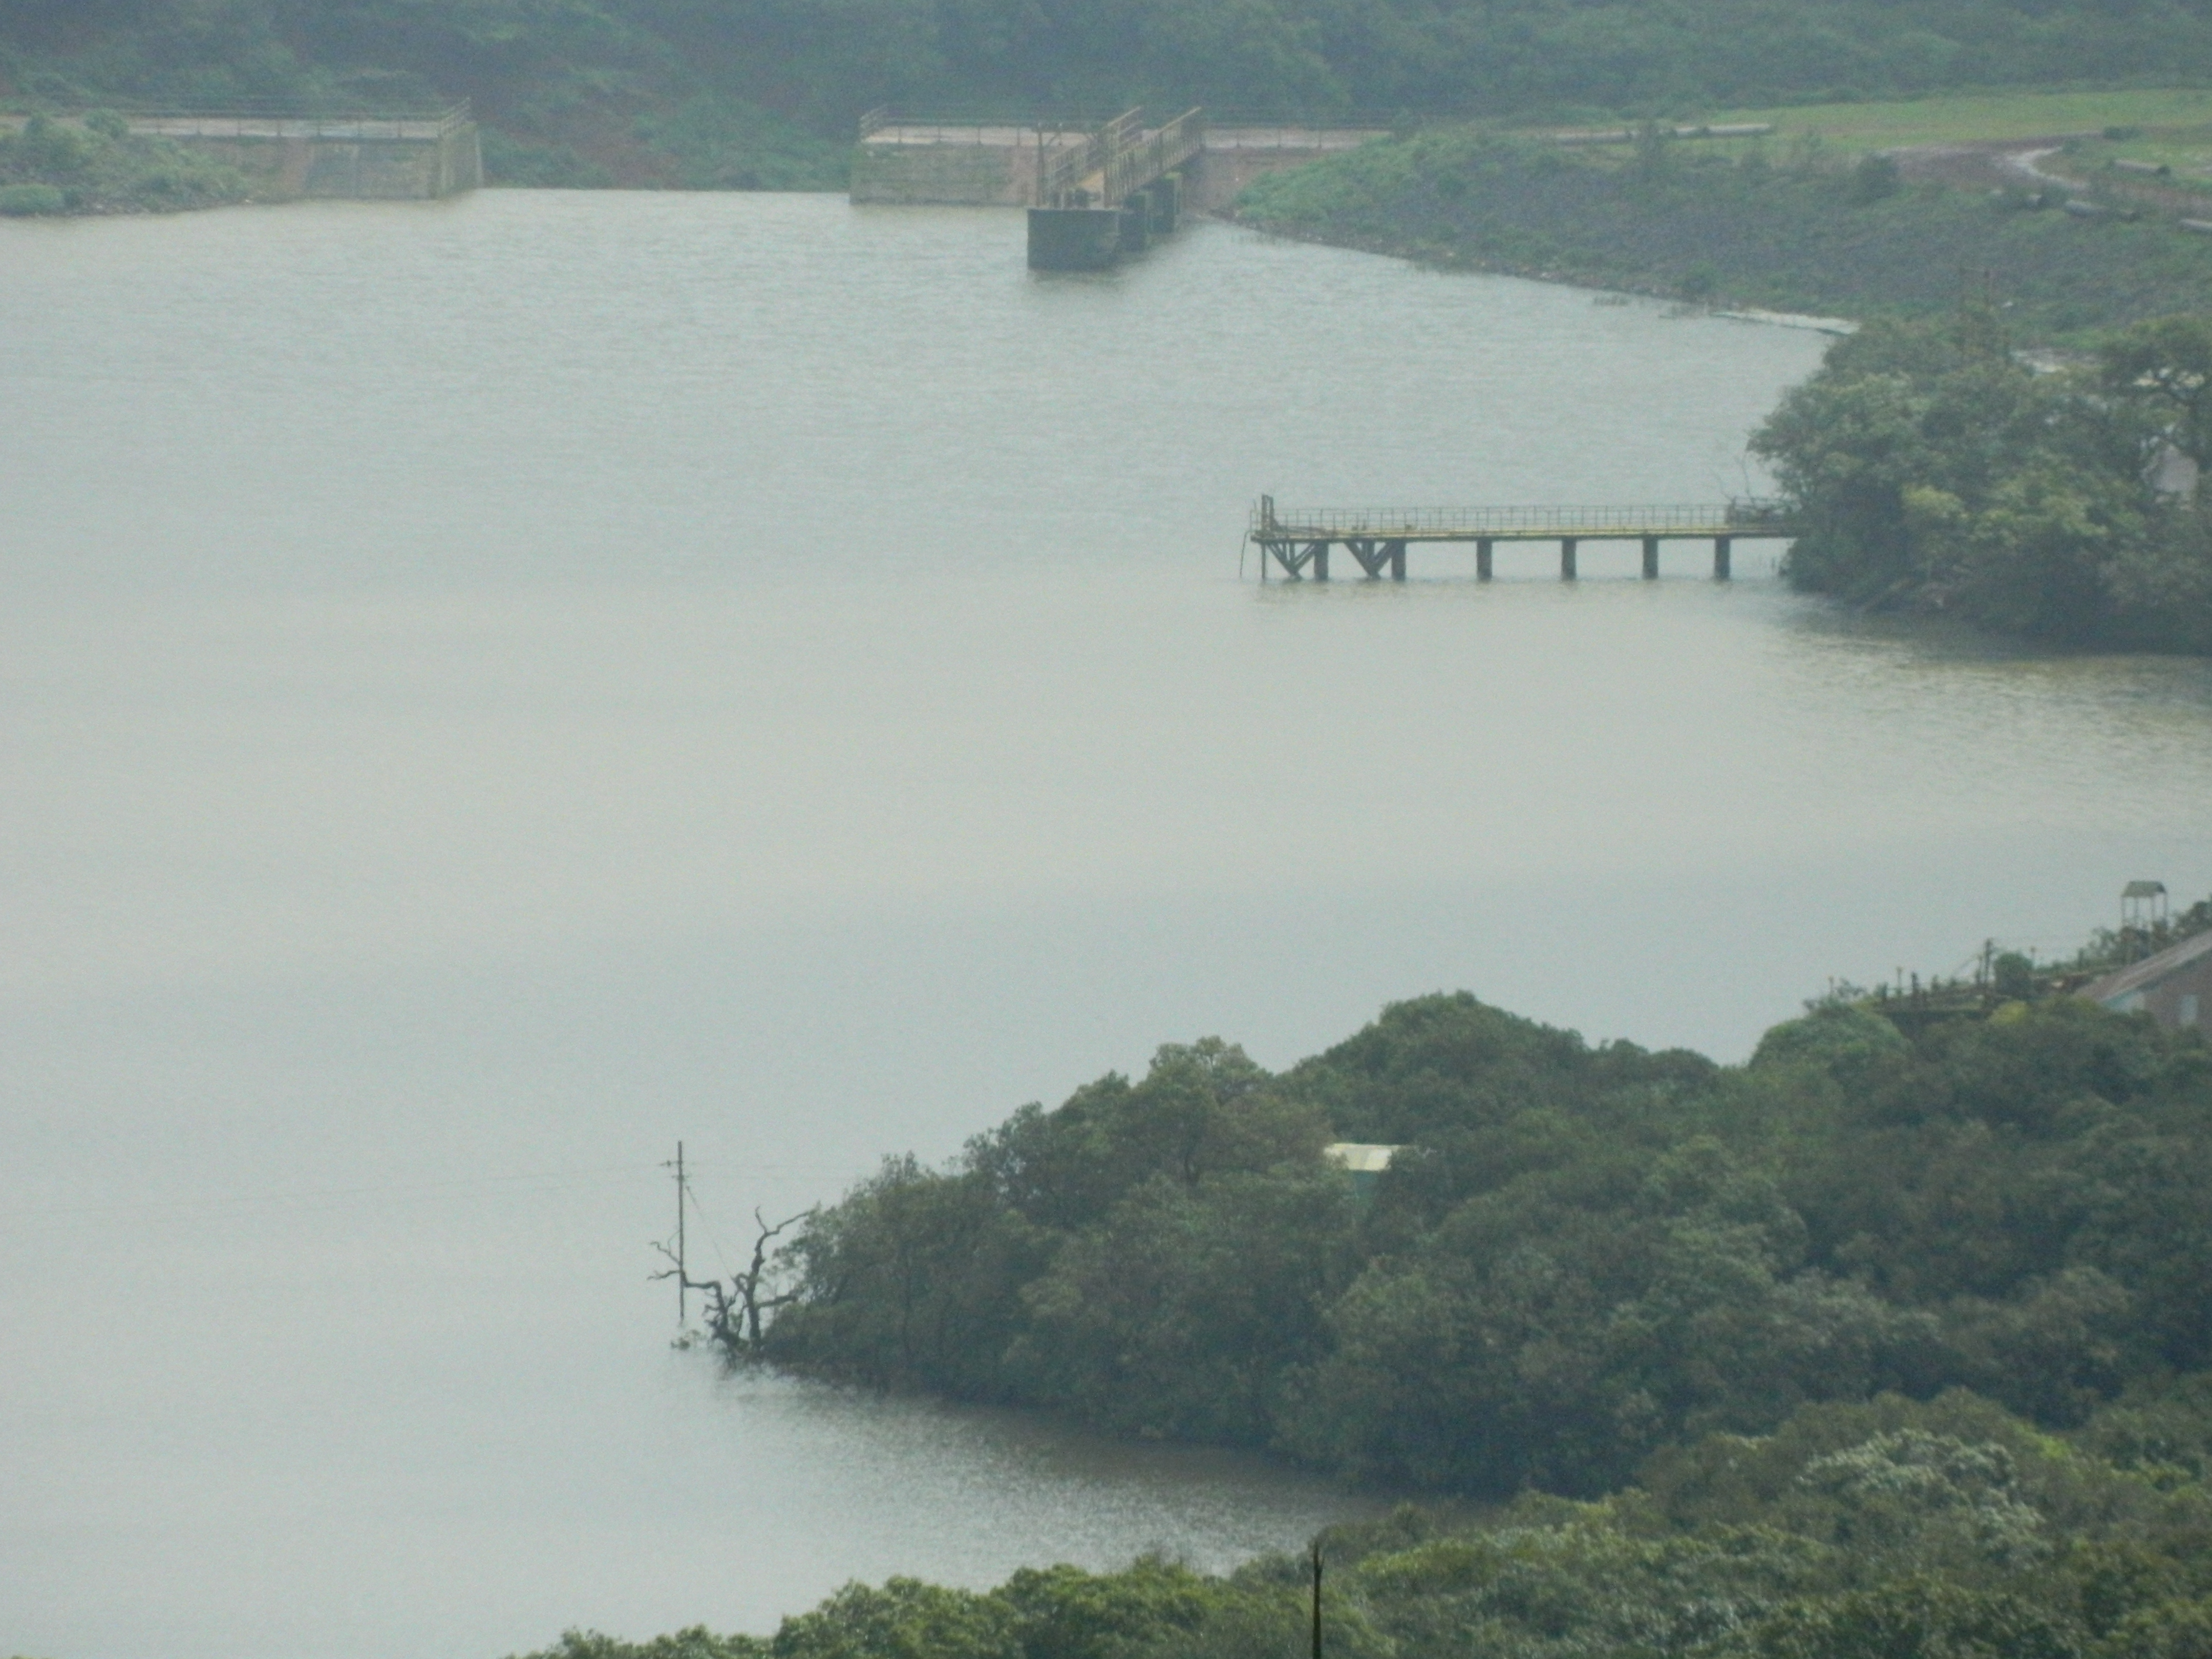
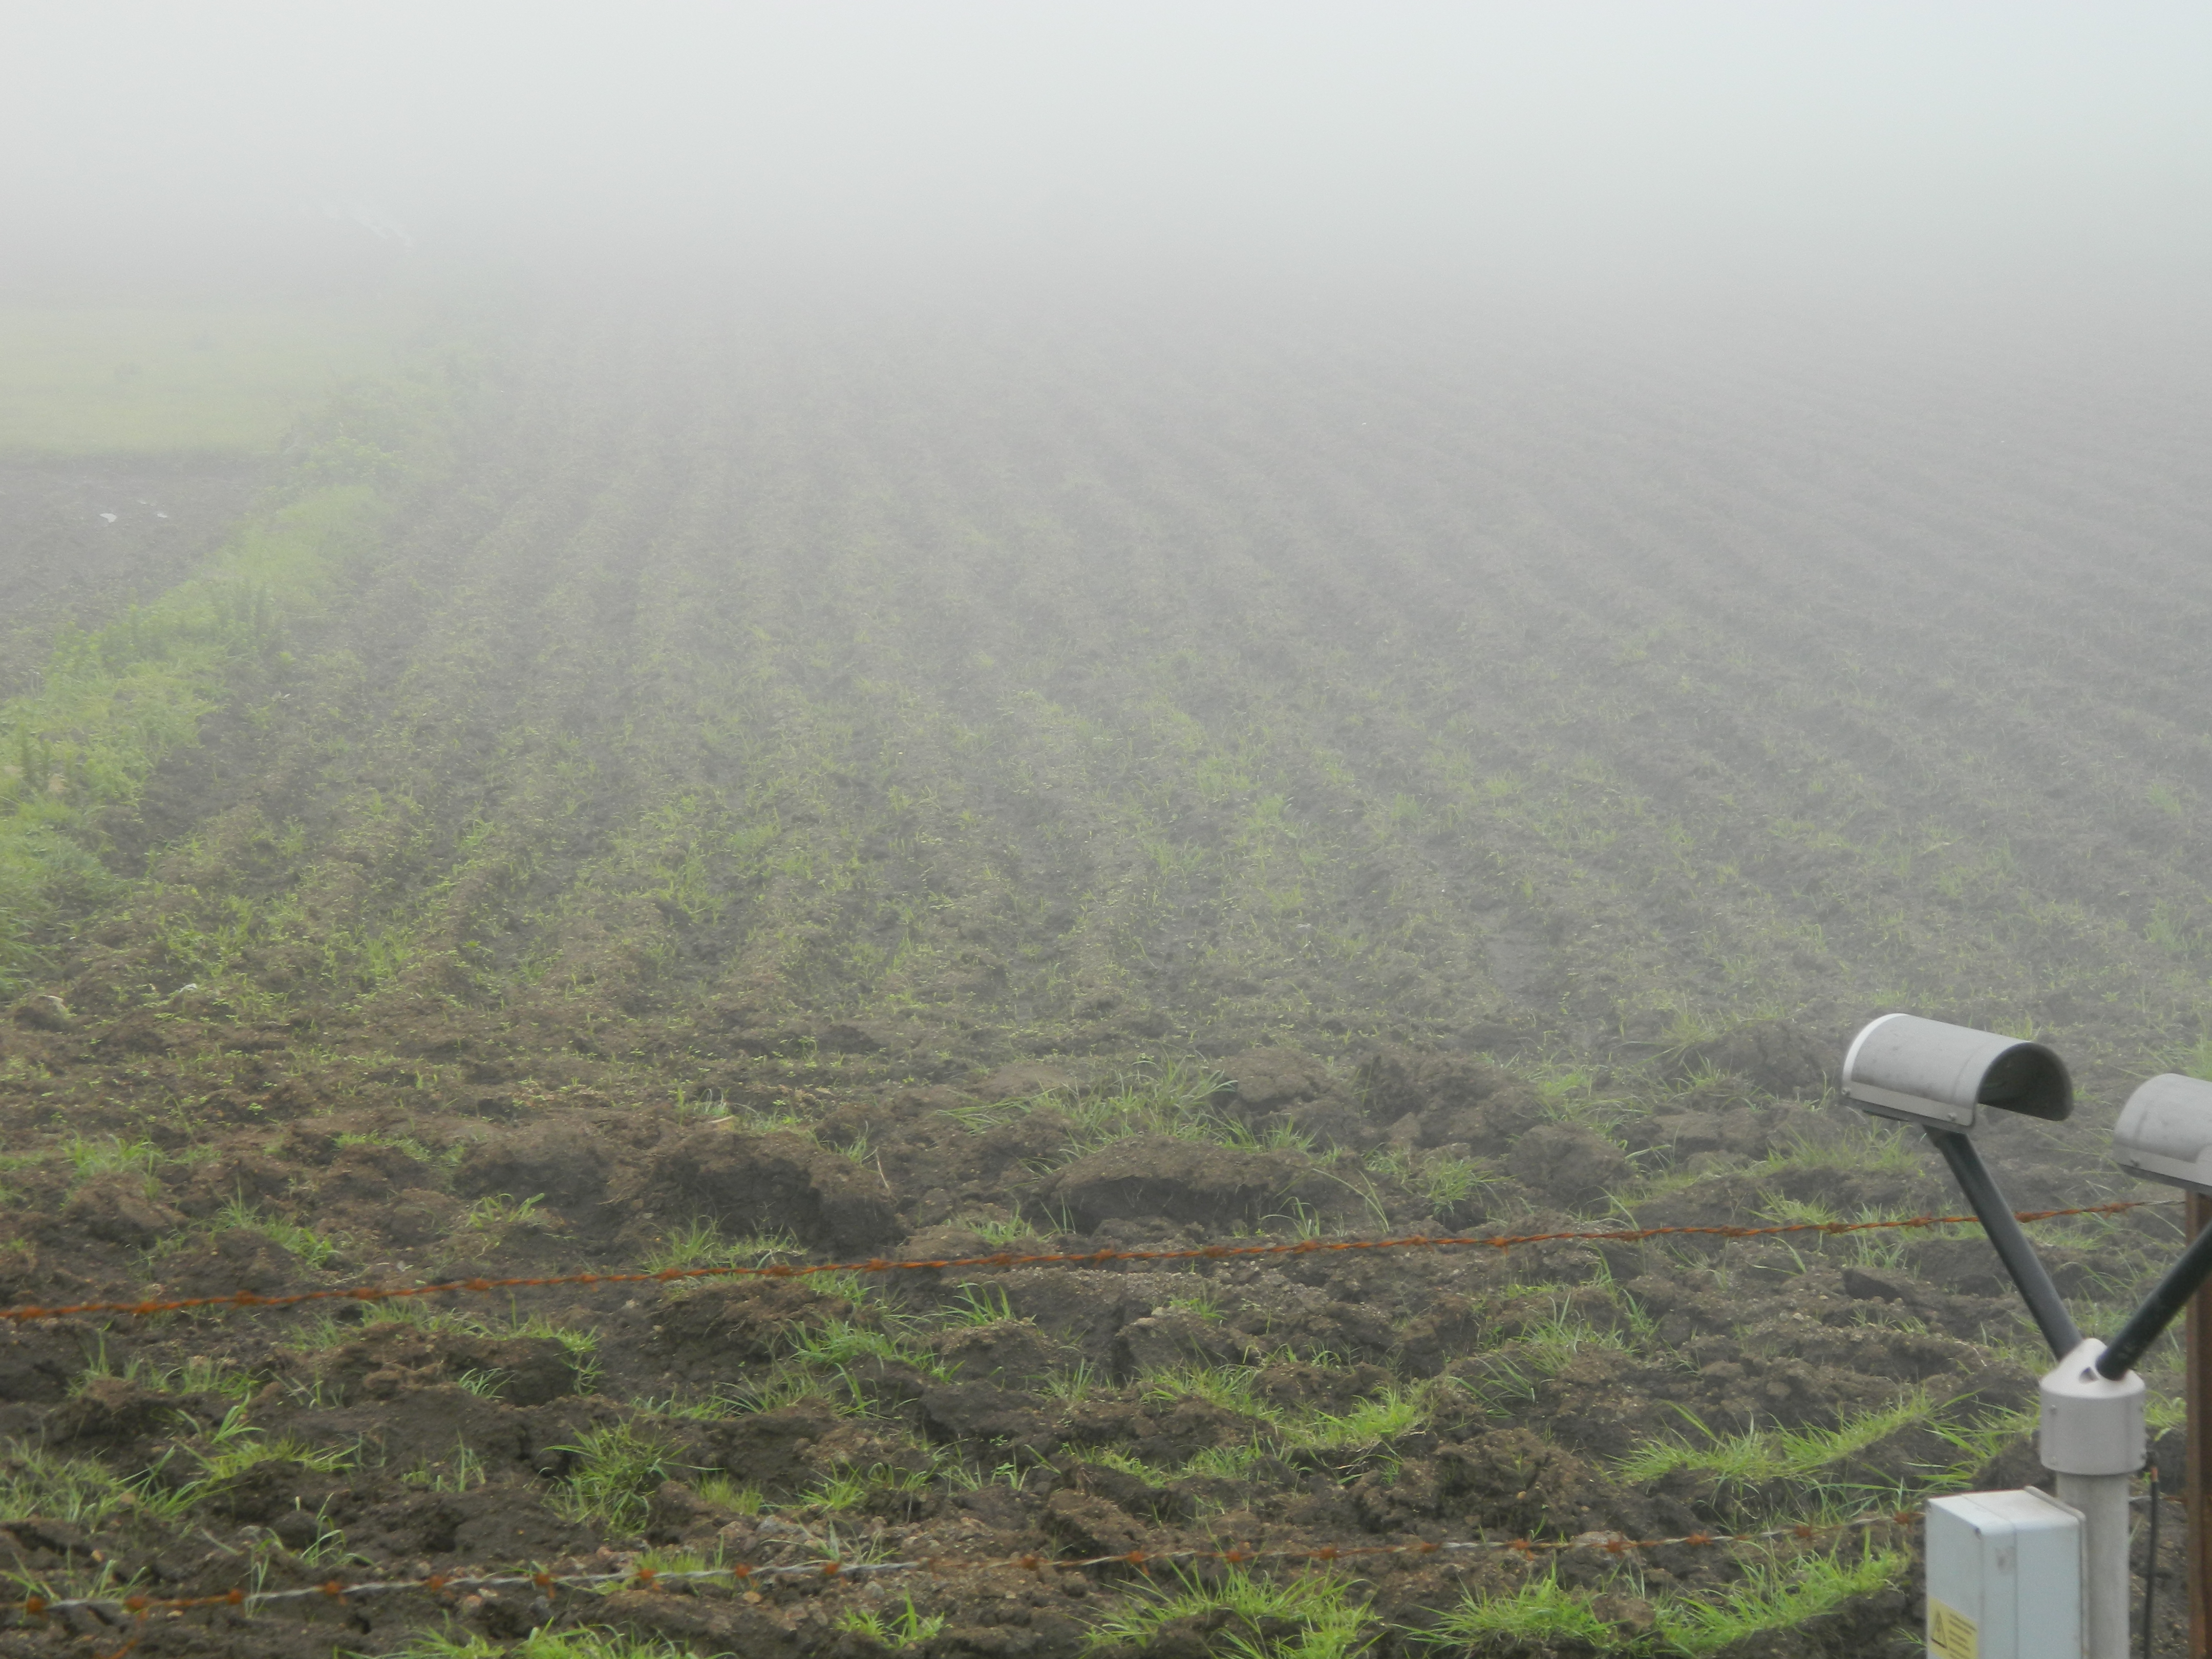
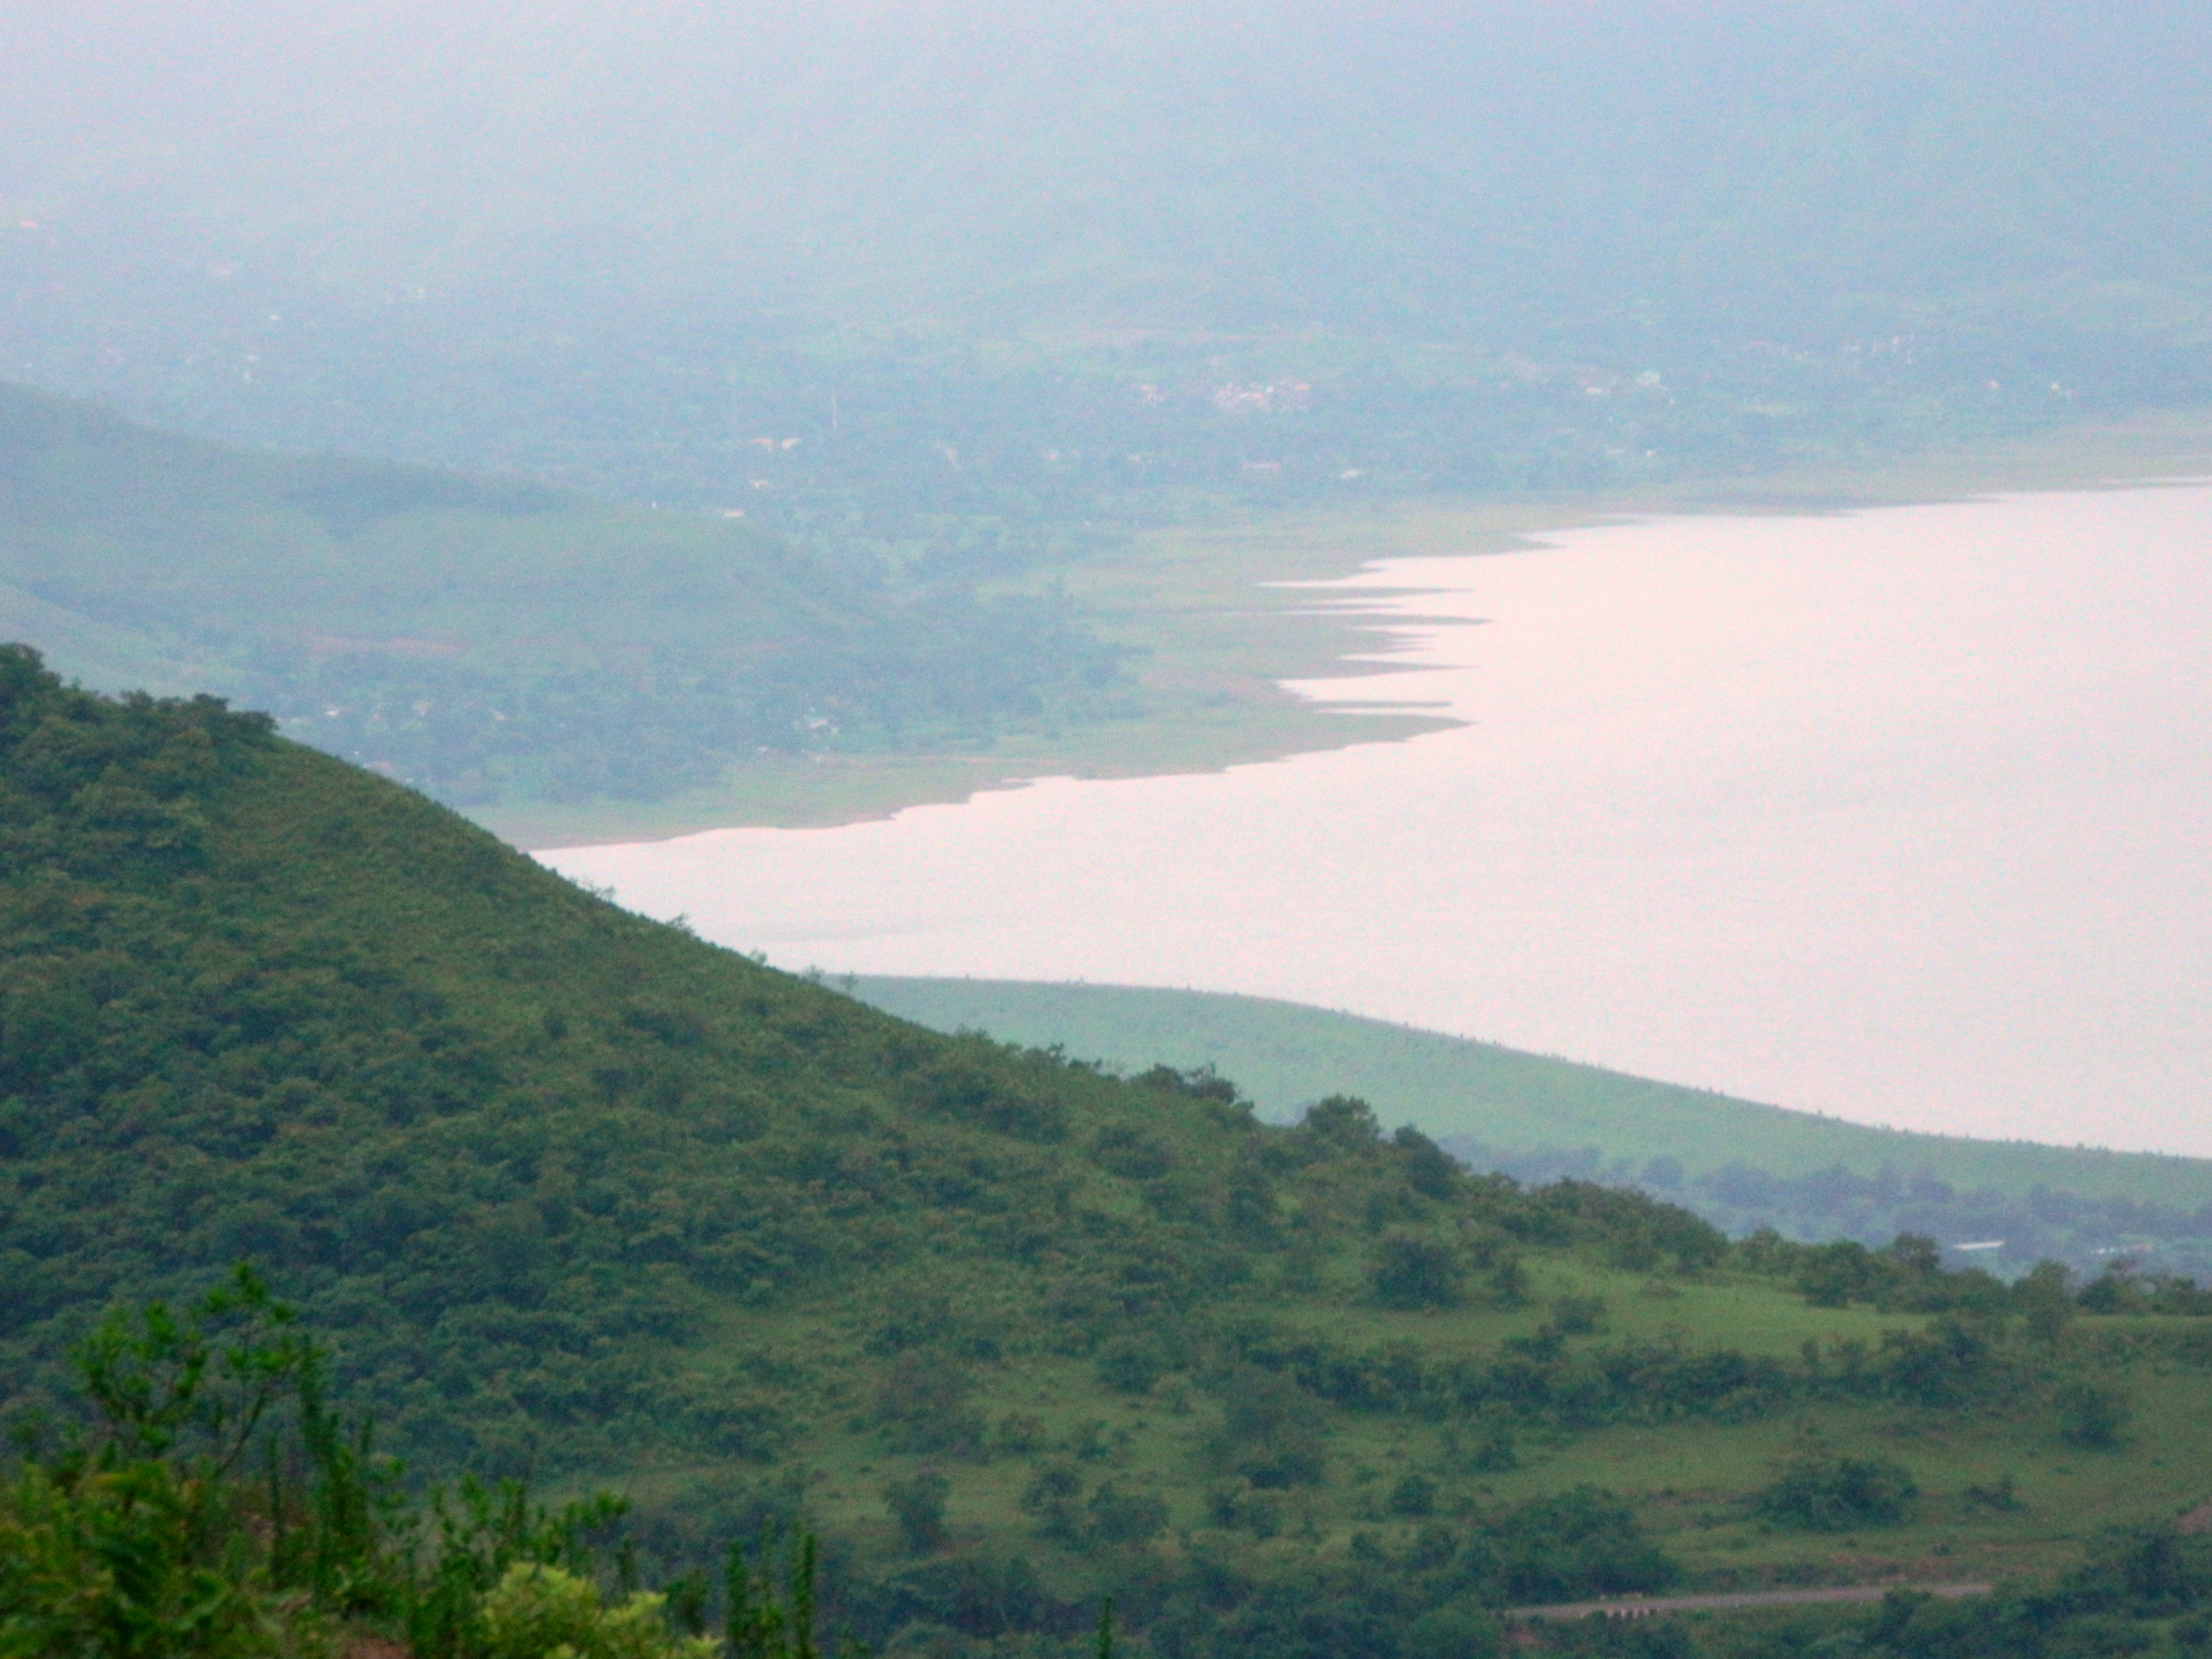
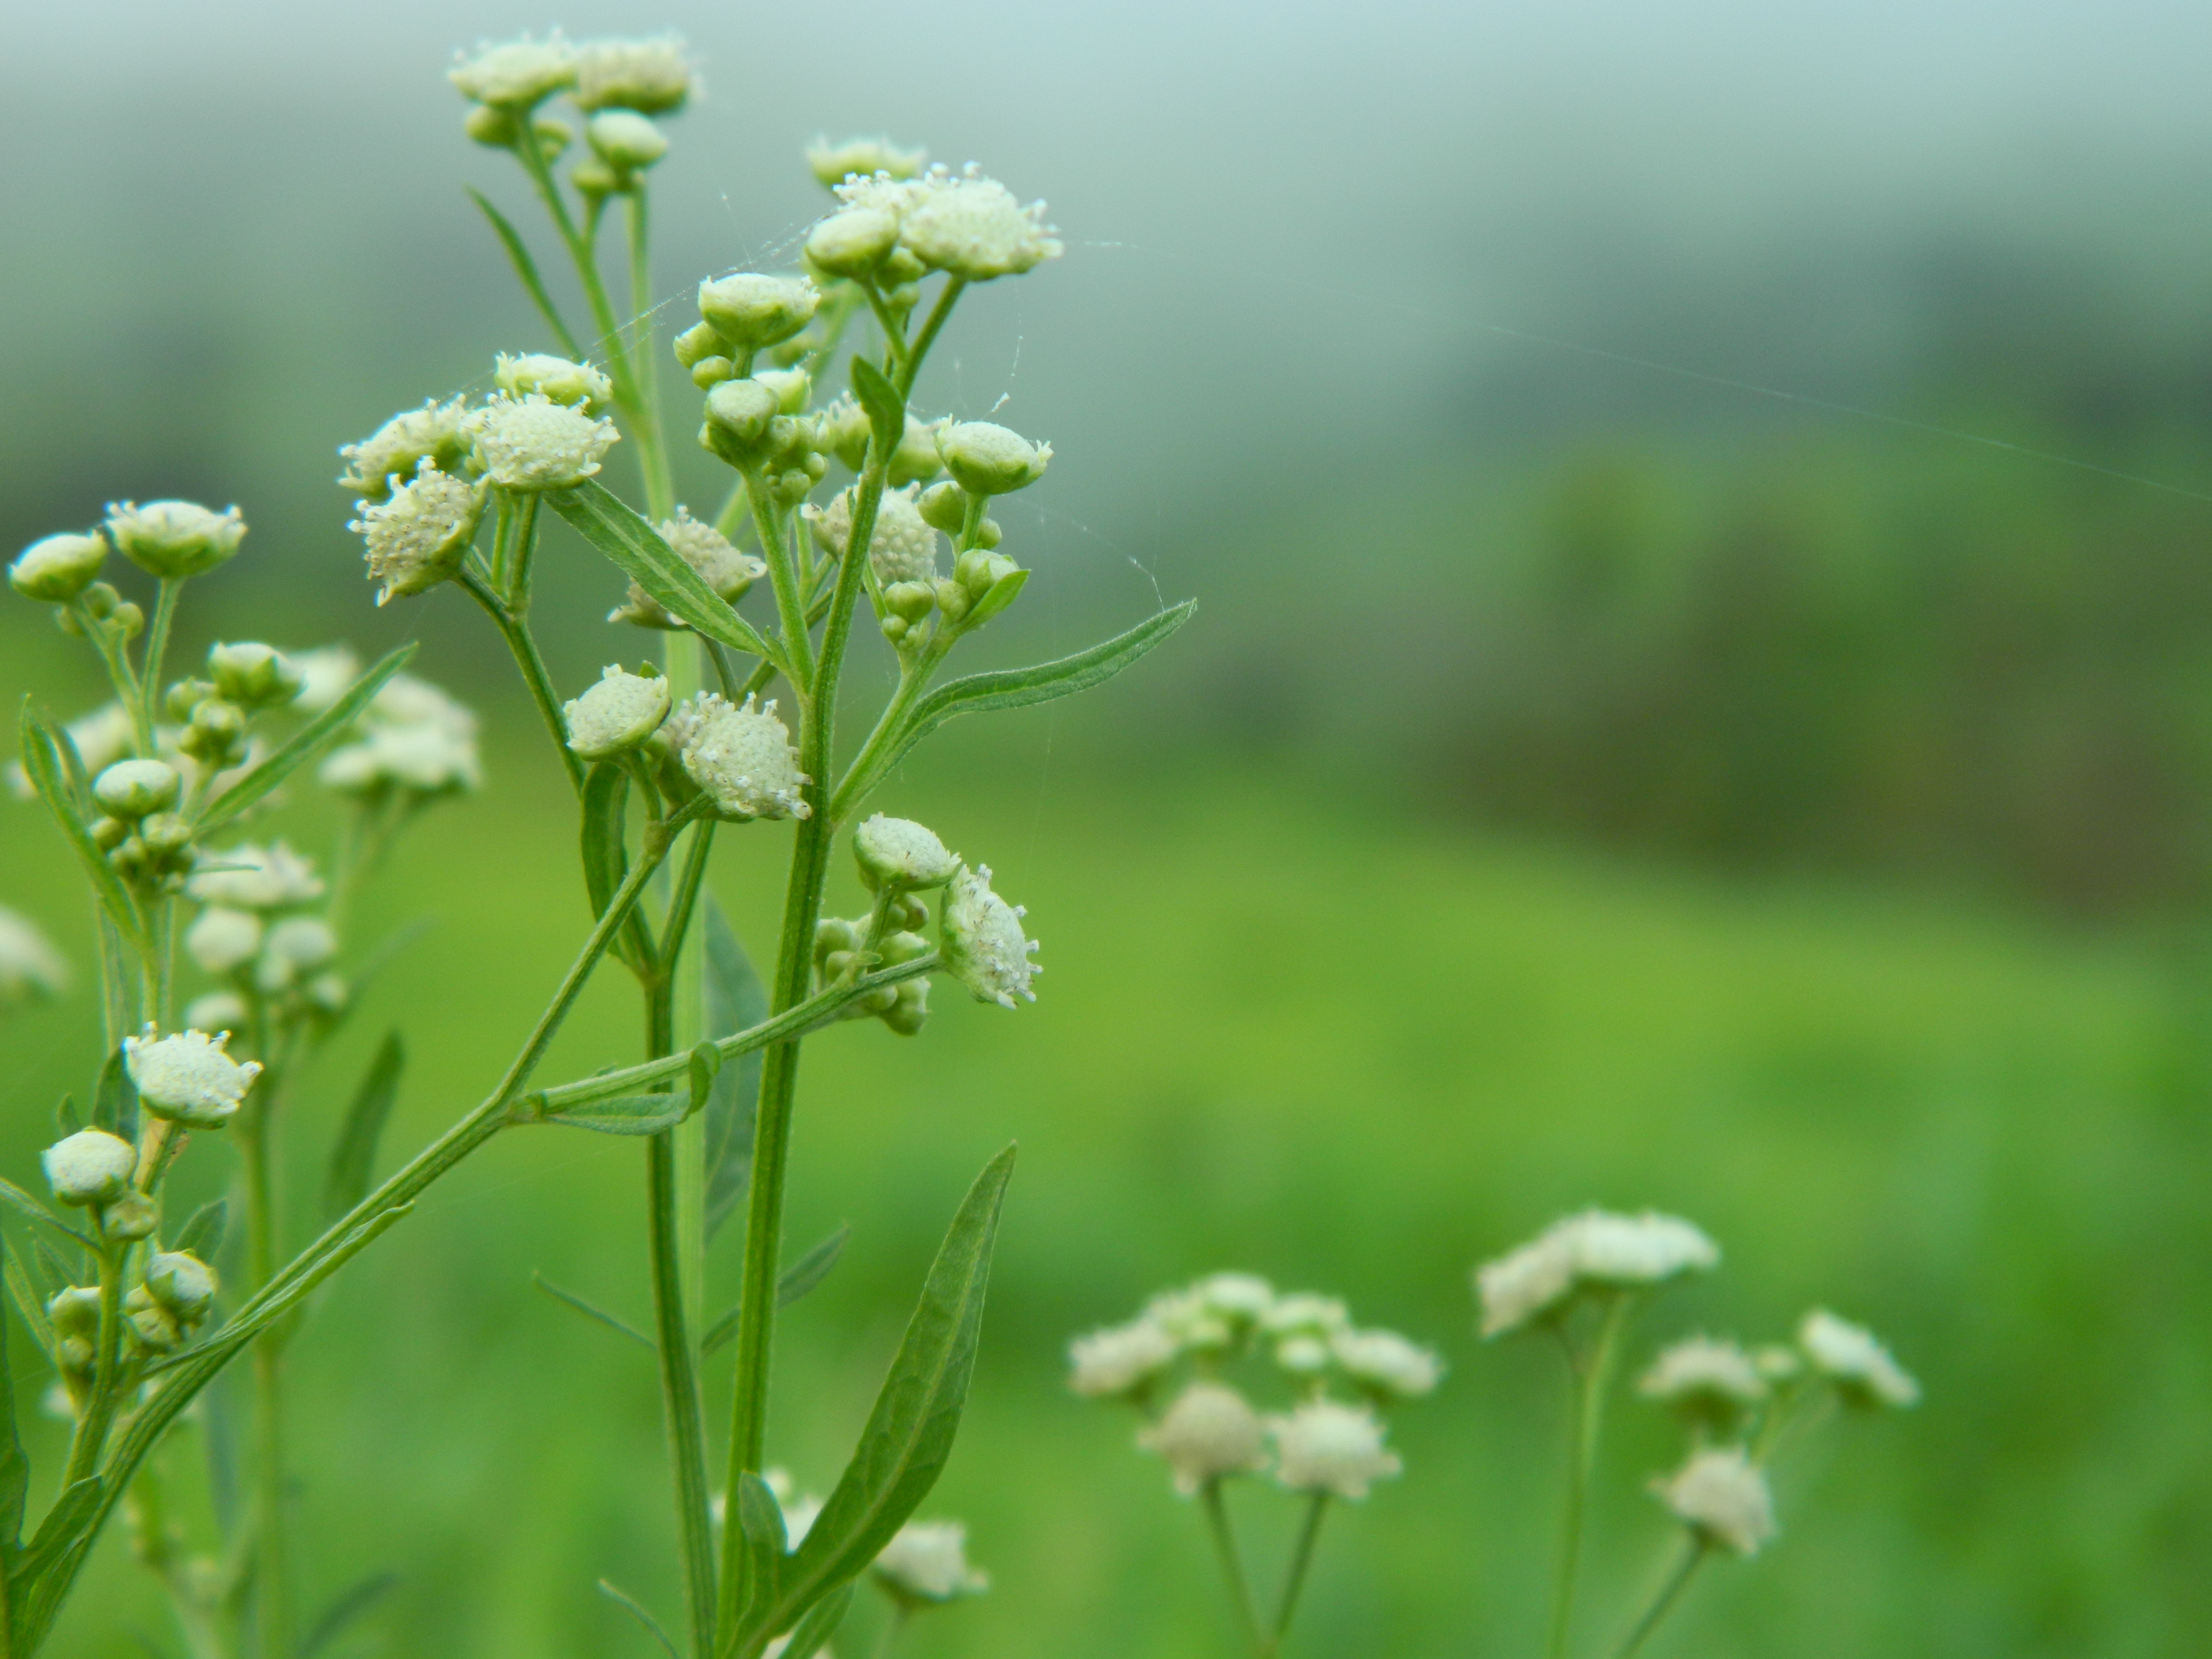
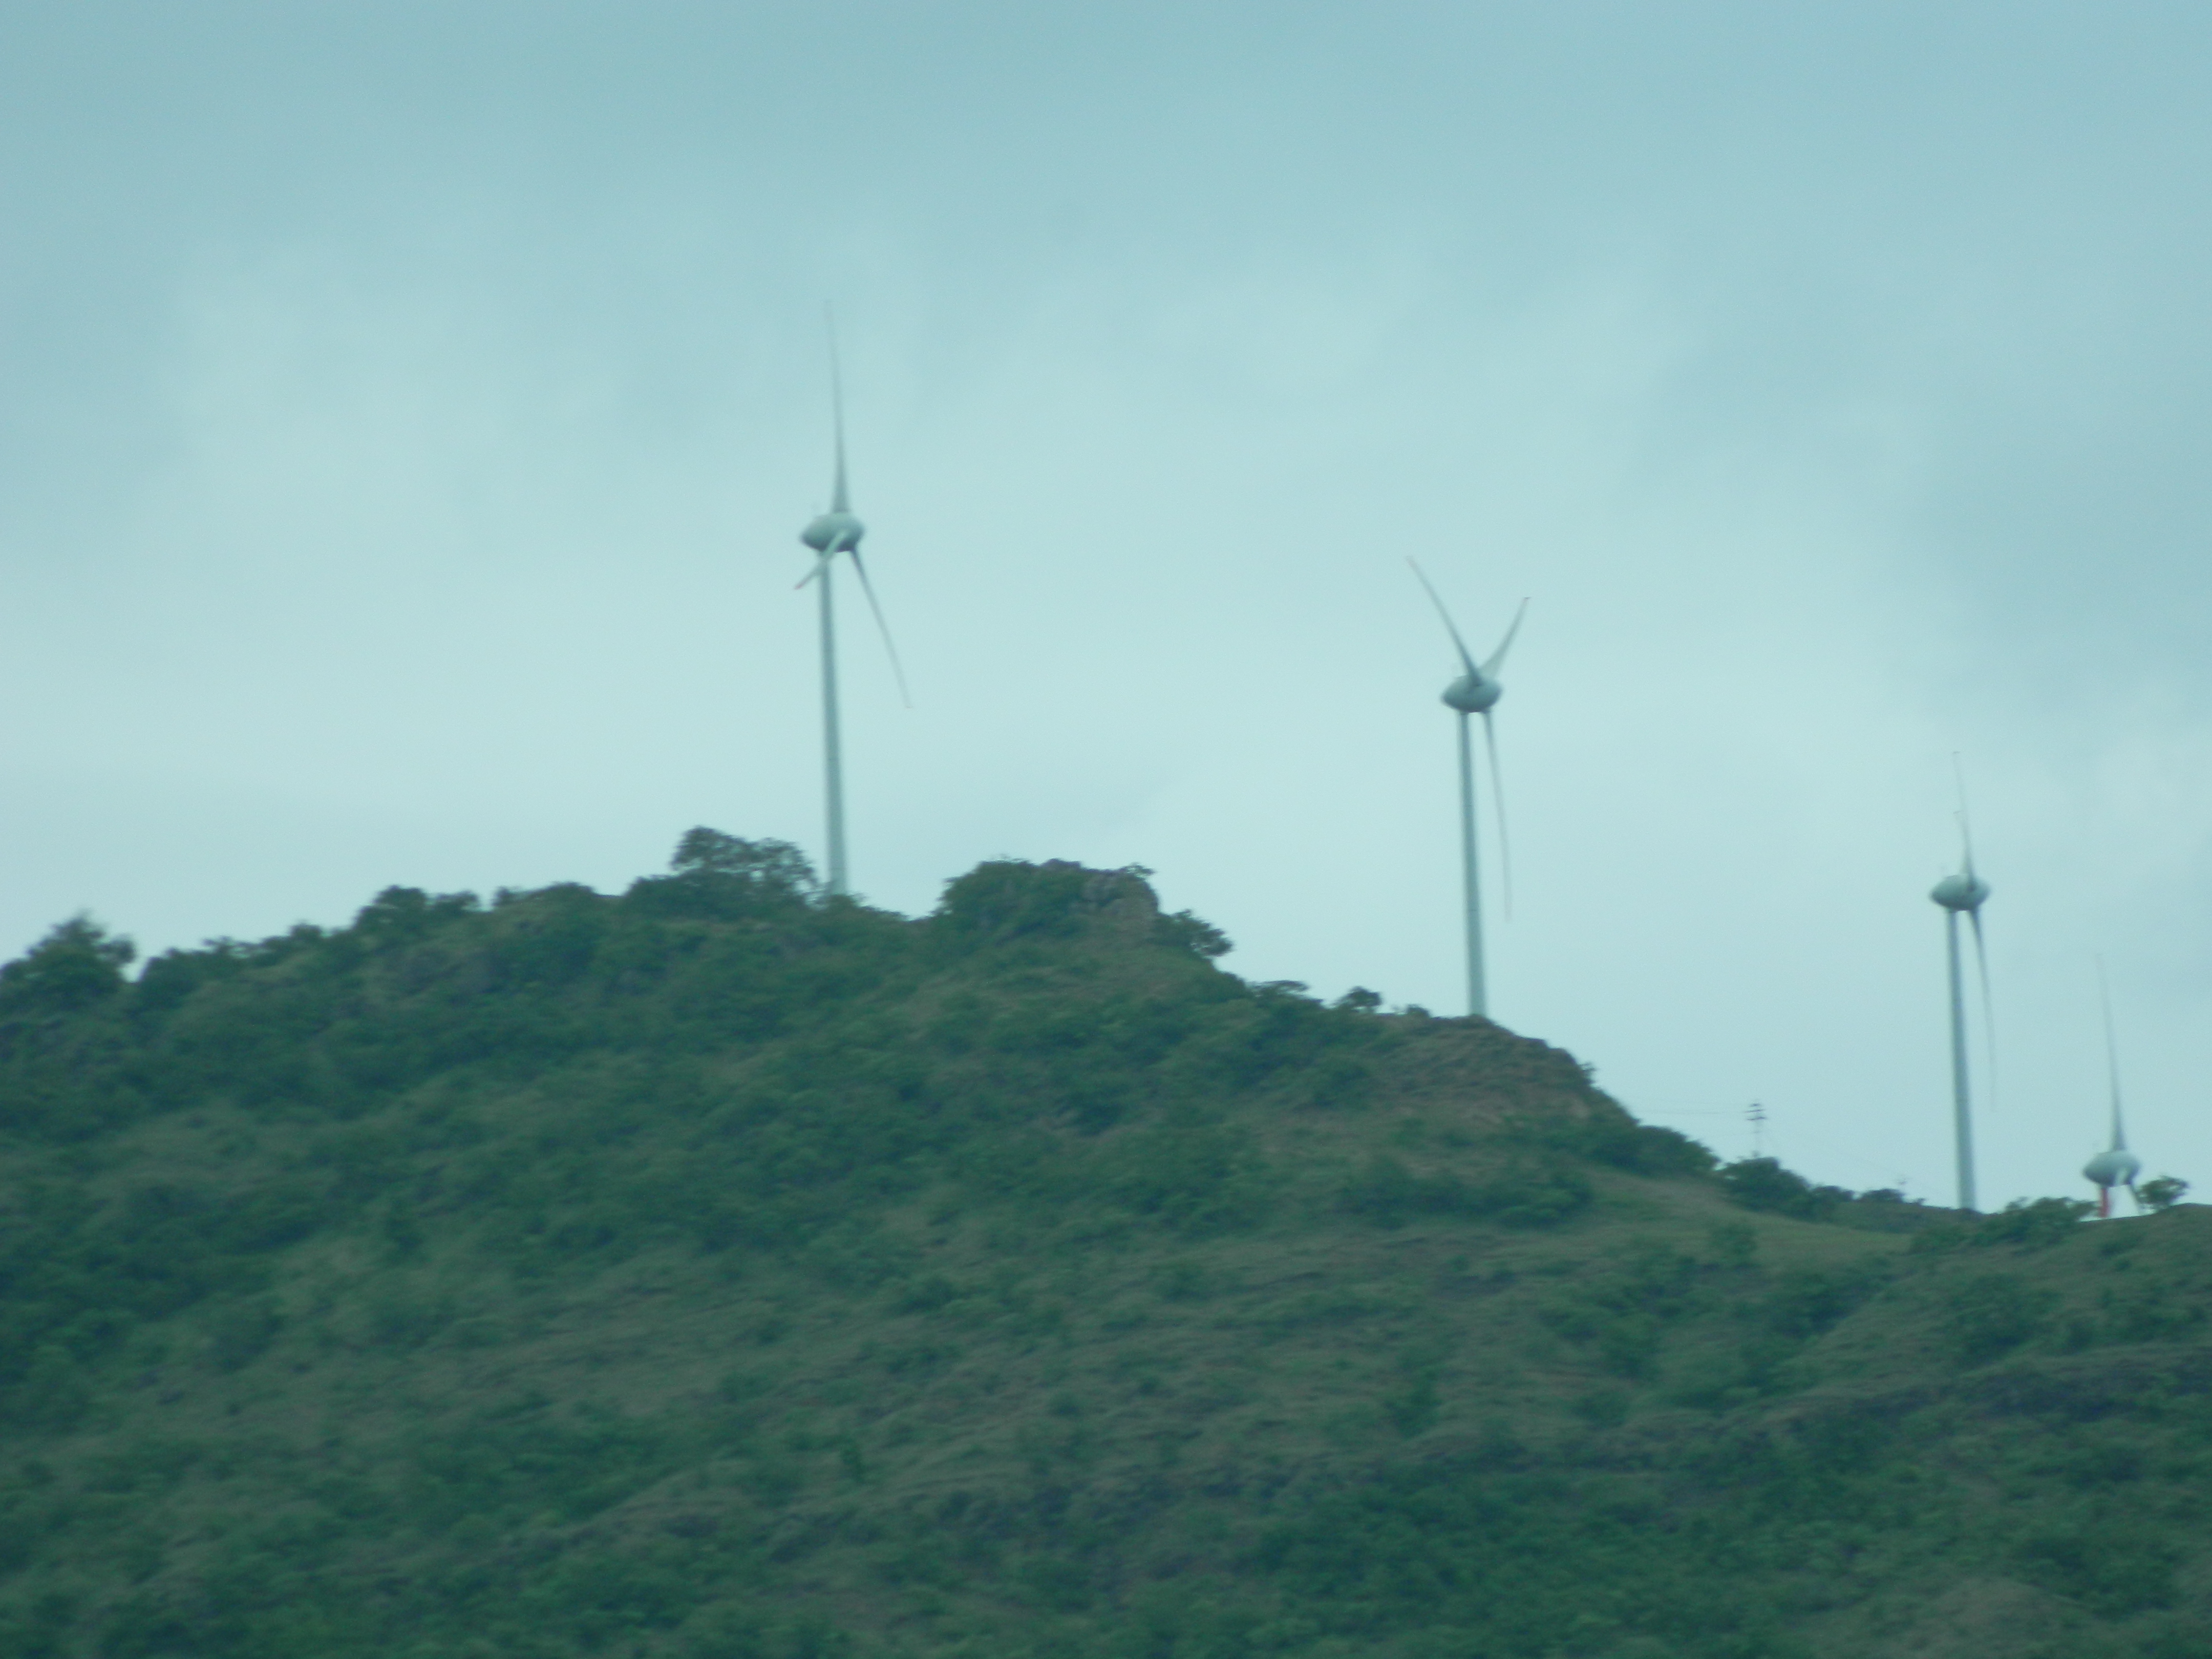
Oh and cannot forget the landscapes. Here they go…


Voice of the people