Midnight Entertainment material
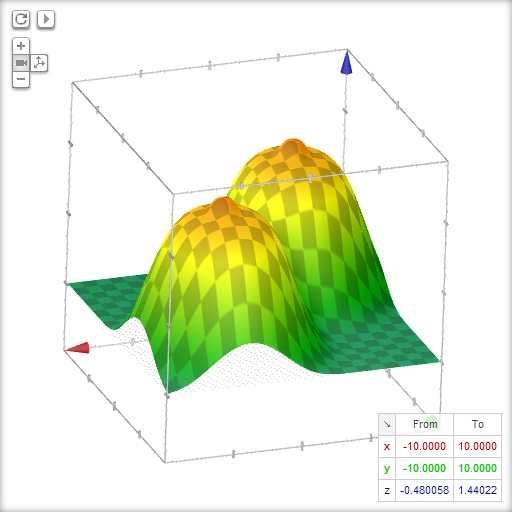
So, I came across a rather interesting equation. The equation can be used to plot a rather “interesting” 3D graph. You don’t need any hi-tech scientific tools to plot this. Just go over google.com and copy paste this equation:
exp(-((x-4)^2+(y-4)^2)^2/1000) + exp(-((x+4)^2+(y+4)^2)^2/1000) + 0.1exp(-((x+4)^2+(y+4)^2)^2)+0.1exp(-((x -4)^2+(y-4)^2)^2)
Come back and tell me what you think 😛
Incoming search terms:
- exp(-((x-4)^2 (y-4)^2)^2/1000) exp(-((x 4)^2 (y 4)^2)^2/1000) 0 1exp(-((x 4)^2 (y 4)^2)^2) 0 1exp(-((x-4)^2 (y-4)^2)^2)
- https://nuclearrambo com/wordpress/midnight-entertainment-material/
- exp(-((x-4)^2 (y-4)^2)^2/1000) exp(-((x 4)^2 (y 4)^2)^2/1000) 0 1exp(-((x 4)^2 (y 4)^2)^2) 0 1exp(-((x-4)^2 (y-4)^2)^2


Voice of the people