
Accurately measuring cable length with NanoVNA
Update: Now you can plot the impedance vs. distance/time plot. Click here to learn the concept.
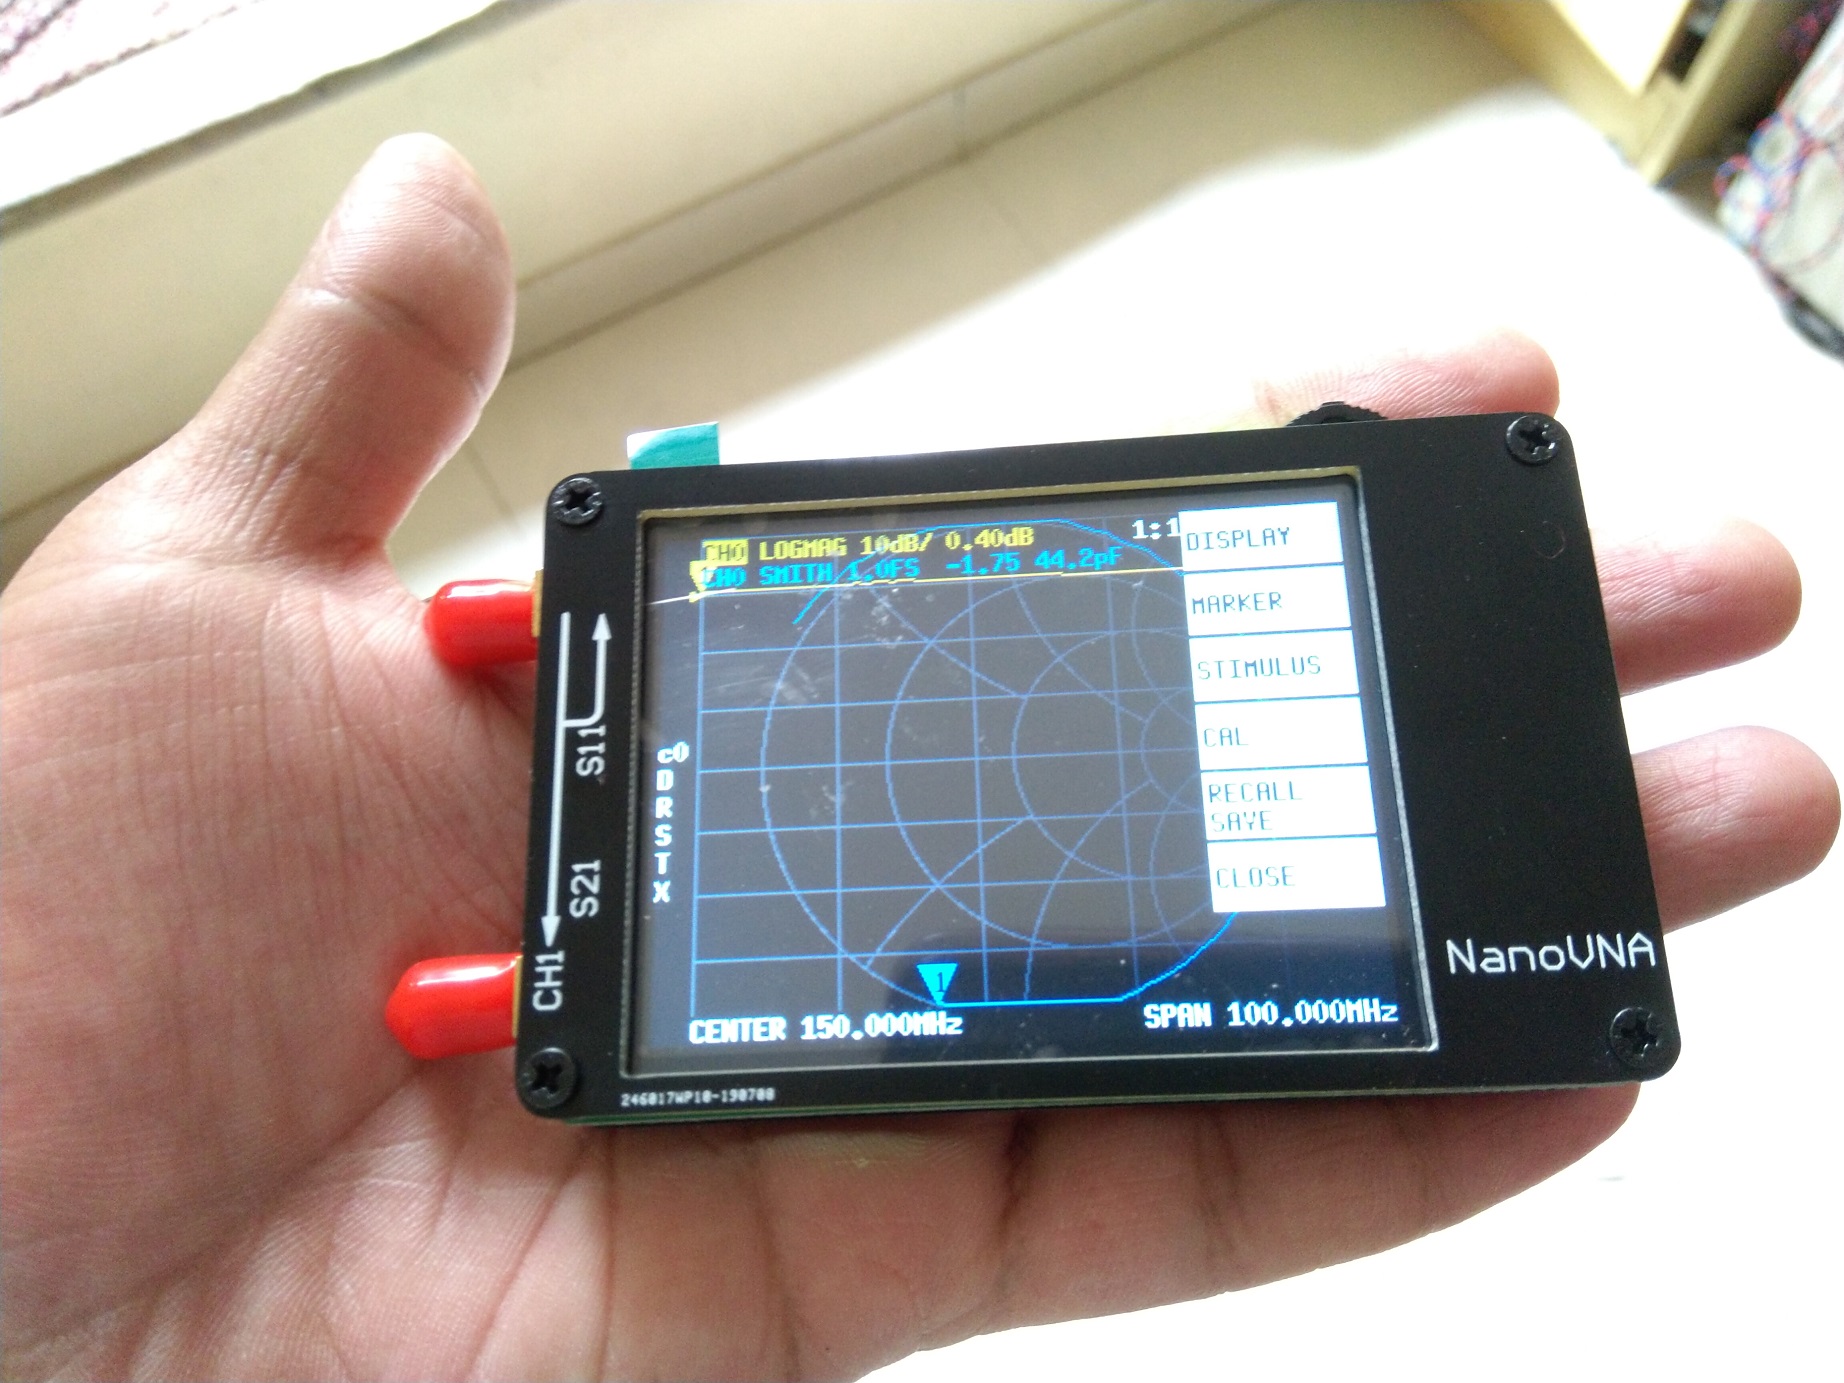
Original Post: Having a VNA opens up so many possibilities. Just last week, I reviewed the nanoVNA and found to be an interesting device to have. Having handled expensive Vector Network analyzers (VNA) in the past and present, my excitement grew tremendously to compare it with the Keysight FieldFox N9952A 50GHz VNA. After achieving comparable results, my happiness knew no bounds because I knew I was going to be able to develop and test the RF circuits at my home without needing to take them to my workplace. The Time domain reflectometry (TDR) measurement on the FieldFox happens to be one of my favourites. I even use TDR regularly for various test cases. One of the test-cases is one-port cable length measurement.
In this article, we will go through some mathematics on deriving TDR response with VNA data. Further, I will explain to you a few use-cases where accurate cable length measurement comes handy. Of course, I will provide you with a shabbily written Python script in this article for you to try all this at home.
Deriving Time response from Return loss
Remember that the VNA does its measurements in the frequency domain. The X-axis represents the frequency whereas the Y-axis represents the magnitude of return loss or insertion loss in dB. We all know the basic relation of frequency and time.
\( F = \frac{1}{t}\)
If we transform the frequency domain data into the time domain, we should see the time domain nature of our measurement. In order to understand this, we need to understand the concept of return loss. Imagine, you have an open-ended coaxial cable connected to your radio transmitter. If you happen you transmit through this open cable, the entire signal is going to propagate to the end of the cable and reflect back towards your transmitter.
As we all know, VSWR of an open or short circuit cable is always very high. In terms of return loss, we are going to see 0dB on our charts. So, if return loss tells us about the reflected signal, it should also tell us some information about the source of reflection. The answer to this lies in the phase of the return signal. By using the magnitude and phase of the signal measured throughout the frequency sweep, we can compute the distance from where reflection occurred.
A little math
A few of you might know that Discrete Fourier transform (DFT) helps us visualize our signals in the frequency domain. The waterfall or the spectrum that you see with the help of RTL-SDR uses Fast Fourier Transform, commonly known as FFT (A faster DFT algorithm). In short, Fourier transform helps us transform our time-domain signal into the frequency domain. In the case of our VNA measurements, our return loss data is already in the frequency domain. How do we work from there? We have inverse Fourier transform that will transform frequency domain data back into the time domain representation.
We will use exactly that principle in our little experiment here.
\( \text {Return Loss} \stackrel { \mathcal{IFFT}} {\rightarrow} \text {Time Domain reponse}\)
The maximum cable length that we can measure depends on the frequency step size. For example, the nanoVNA can only measure 101 points in any given frequency span. If we set the frequency span starting with 10MHz and ending at 295MHz, the frequency step size is going to be 2.82MHz.
\(\Delta F = \frac{\text{Stop Frequency – Start Frequency}}{\text{Number of points}} \)
\(\text{Therefore, } \Delta F = \frac{\text{295MHz – 10MHz}}{\text{101}} = 2.82MHz \)
Now that we know the frequency step size, we can calculate the maximum reflection time we can measure.
\(\text{Maximum reflection time} = \frac{1}{\Delta F} = \frac{1}{\text{2.82MHz}} = 354.6 ns\)
Converting time to distance
The result of the above equation comes out in terms of few hundred nanoseconds. Remember, we are still talking in terms of time and frequency. We still need to calculate the maximum cable length. The maximum cable length will differ from cable to cable. This is because the signal travels at different velocities in different types of cables. For example, the signal travels at a speed of 83% of speed of light. In case of RG405, the signal travels at a speed of 70.3% speed of light. This velocity of propagation is denoted mathematically as \(v_p\).
\(\text{Therefore, maximum cable length }= v_p \times \mathcal{c} \)
There’s nothing to be afraid of. We are all familiar with the relation of \(\text{speed, distance & time}\).
\(speed = \frac{distance}{time}\)
Now, try to relate this with the equation stated previously to compute maximum cable length.
Our basics are now clear, so we should be fine to proceed with handling the actual data from the VNA.
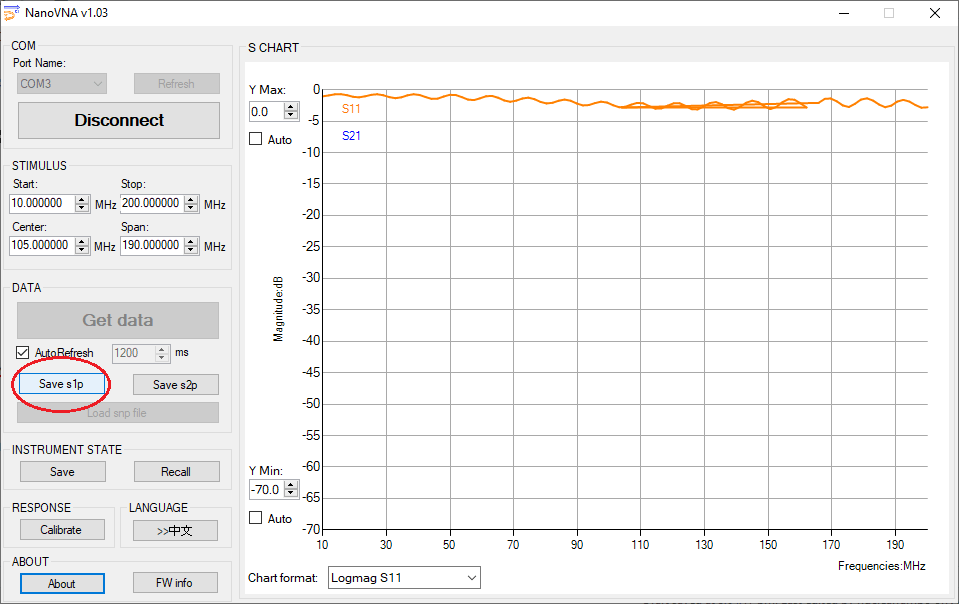
Now, how do we get access to our return loss data? Like we saw in our previous nanoVNA review, we will make use of the nanoVNA Windows application here. Make sure that you calibrate your device before proceeding further. Again, if you wish to know how to calibrate nanoVNA, head back here. Now, coming back to our main question, how do we access return loss data? The windows application allows us to save a touchstone S-parameter file. It is marked as “S1P” on one of the buttons. We shall use this feature to retrieve the data.
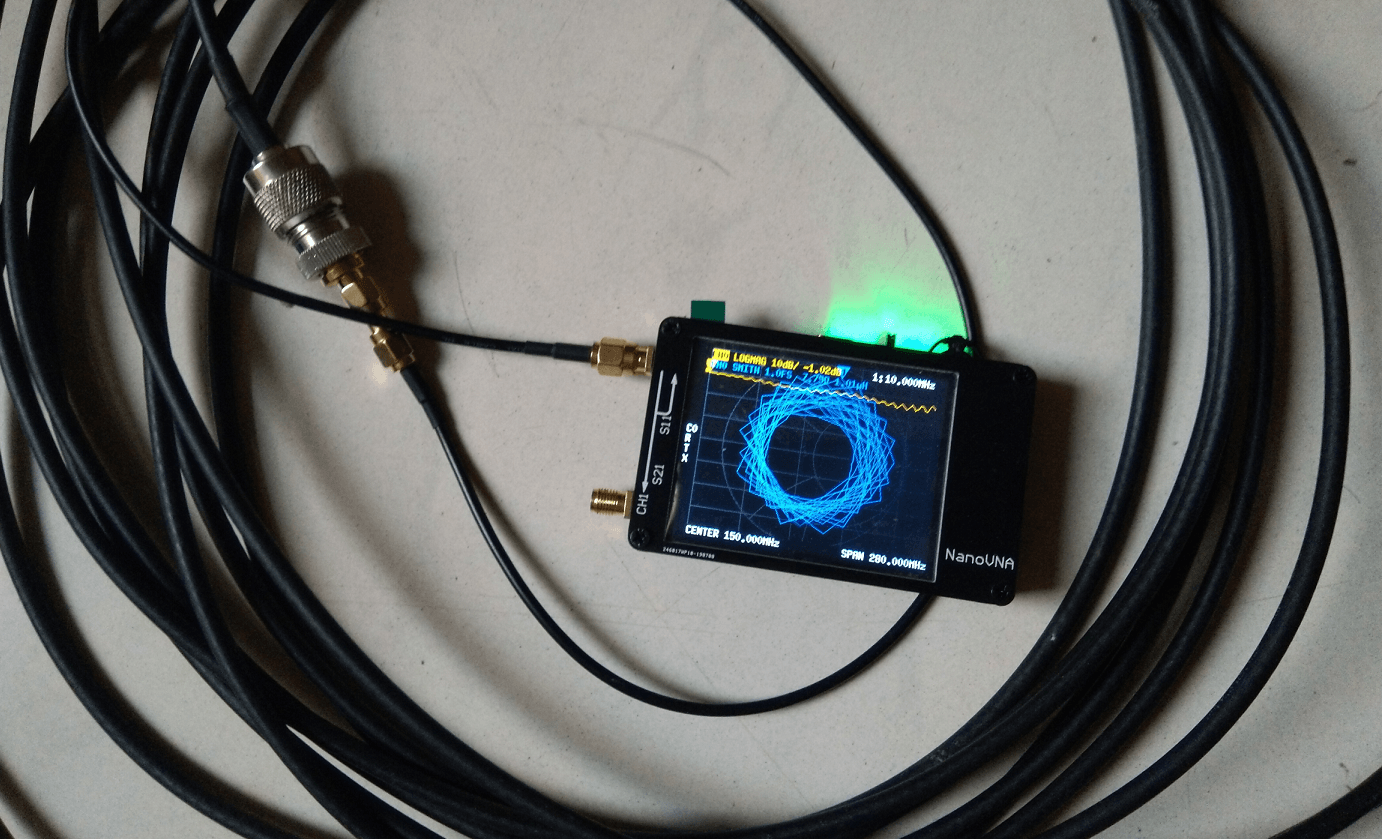
The setup
Before we move any further, let me explain the setup.

All you need is your nanoVNA kit and a piece of cable with a connector on one end that can be attached to the VNA. Oh, you will also need a PC to run the VNA application and the python script.
As indicated above, calibrate your VNA and connect a piece of cable to the VNA port. Make sure that the other end of the cable is left open and not connected anywhere.
Now, click the “Save S1P” button to save the one port return loss measurement.
The python script
I wrote a little script that does the following things:
- Read the S1P file and get S-parameter data \(S_{\text{11}}\)
- Get the frequency step size. \(\Delta F\)
- Calculate maximum reflection time and in turn, calculate maximum distance measurable
- Transform \(S_{\text{11}}\) from frequency domain to time domain using Inverse Fast Fourier Transform
- Find the peak in time data and corresponding time at which it occurred. This peak corresponds to the reflection occurring from the open end of the cable
- Compute the distance by multiplying \(v_p\) with time.
For everyone’s relief, I am attaching the entire script here.
|
1 2 3 4 5 6 7 8 9 10 11 12 13 14 15 16 17 18 19 20 21 22 23 24 25 26 27 28 29 30 31 32 |
import skrf as rf import matplotlib.pyplot as plt from scipy import constants import numpy as np raw_points = 101 NFFT = 16384 PROPAGATION_SPEED = 70.3 #For RG405 _prop_speed = PROPAGATION_SPEED/100 cable = rf.Network('cable_open_2.s1p') s11 = cable.s[:, 0, 0] window = np.blackman(raw_points) s11 = window * s11 td = np.abs(np.fft.ifft(s11, NFFT)) #Calculate maximum time axis t_axis = np.linspace(0, 1/cable.frequency.step, NFFT) d_axis = constants.speed_of_light * _prop_speed * t_axis #find the peak and distance pk = np.max(td) idx_pk = np.where(td == pk)[0] print(d_axis[idx_pk[0]]/2) # Plot time response plt.plot(d_axis, td) plt.xlabel("Distance (m)") plt.ylabel("Magnitude") plt.title("Return loss Time domain") plt.show() |
Real Results
Everyone must be looking forward to watching this section of the article. I tested this script by connecting a small 36 inches of RG405 cable which comes to approximately 0.91 meters. The velocity factor for RG405 cable is 70.3% which is set in the code at line 8. After doing all sort of computation, line 25 prints out the distance in meters.
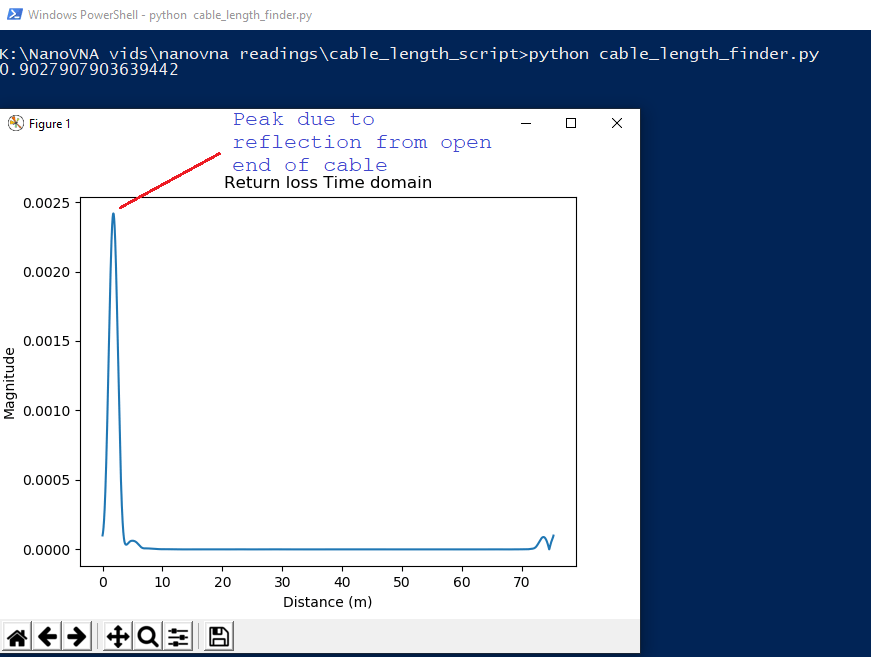
Comparing the actual cable length which is 0.91 meters and then looking at our results gives me great satisfaction. The error is quite small and it could even be due to calibration or temperature drift. Of course, an error of 3cm is unacceptable if you are working in the GHz range and you shouldn’t be even using this instrument in the first place.
Let us measure another cable, this time a LMR200. Now, the exact length of cable we are about to test is unknown to me. According to the markings on the cable, it should be somewhere in the range of 9.5 to 10 meters.
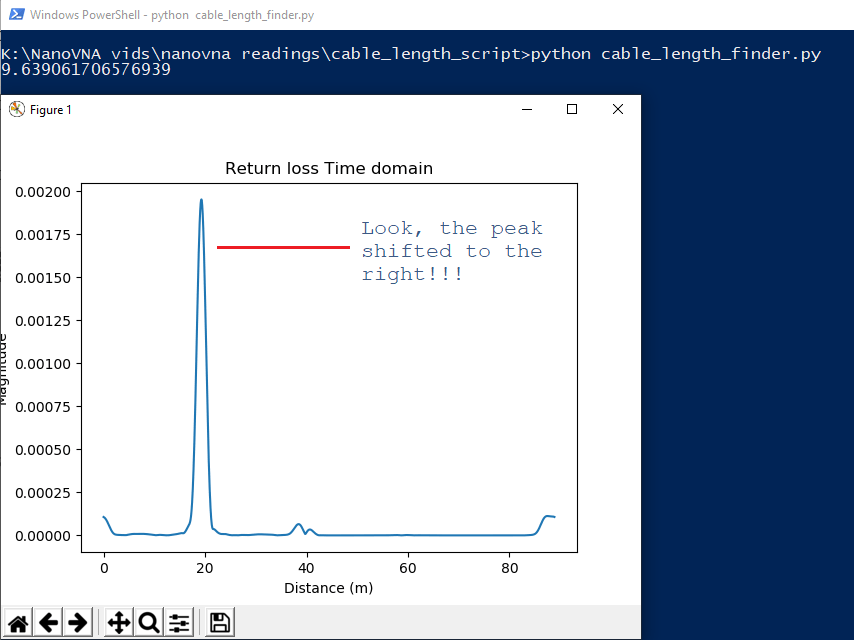
The most noticeable change on the graph is the shifted peak. Our source of reflection, which is the open end of the cable extended further due to a larger cable length. The time taken by the signal to traverse through the cable is much more. On the other hand, our script computed the cable length and it matches our expectation. Considering an error of 3cm based on our previous measurement of a shorter cable, we can say that this reading is totally ACCEPTABLE! Our expectation of the cable length was somewhere between 9.5 meters to 10 meters and our script computed the length as 9.639 meters!
Where do I plan to use this?
When you are constructing antenna arrays, the feed cable length needs to be precise. This is required so that the antennas are phased correctly and in turn operate as expected. Without relying on expensive equipment, I can now do cable length matching sitting at home.
Our little script can also work to find faulty cables. Distance to fault can be known by looking at the graph and observing the measurements carefully.
Additionally, we can also figure out bad, faulty connectors by looking at the time domain graph. Badly soldered connectors are quite common and sometimes hard to spot but not anymore with TDR!
Having a nanoVNA surely opens many avenues for hobbyists. I am hoping that once enough people get their hands on this device, we will start to see so many other interesting experiments starting to pop-up over the internet. Not to forget, we might even see a FULL 2-port VNA pop up someday which could be affordable by hobbyists like me.
Awesome Salil. You should post to the NanoVNA group on groups.io as well.
cheers,
Vince
I guess you already did! Thanks 🙂
Excellent article Salil.
I have spent the last 9 month building a UWB tester. UWB measures Time Of Flight and thus distance. So obviously I simulate distance using RF switches and different length cables. A delay box. There’s a few other goodies in the tester part. But anyway
This page shows me how I can use a piece of $70 equipment to characterize both my cables, and my delay boxes. The delay is not just the cables, but also the switches which are eval boards, and splitters, and attenuator.
I’m operating at 6.5GHz which is a little higher than 300MHz, but I’m guessing propagation delay will only change a few % going up to 6.5GHz. I’ll be able to verify or benchmark thatanyway against a 12GHz or better VNA.
So Salil you talked me into buying 3 not 1.
Super! You could try going slightly higher on the nanoVNA, like 500-600MHz but I preferred staying below 300MHz because thats where this instrument performs the best.
Coś tu nie tak 🙁
nie mogę dołączyć jpg swoich wyników ale są one zupełnie inne.
Szukaj “Adam Puszczański” w grupie “Krótkofalowcy na FB. Język polski.
Tranlate – przyda się
Thanks for the script 🙂
I added it to the reverse-engineered NanoVNASharp from Roger Clark.
https://zs1sci.com/blog/nanovna-tdr/
Thanks again for your script and the great post!
Amazing work ZS1SCI! I went through your post and really loved the automation. I will surely download from your repo and try it out on my PC.
Is s11 complex or real? Please give me a test data file like “cable_open_2.s1p”.
It is complex.
But I got real S11 from E5071c . The Img part was zero. Please give me the data file so that i can varify that . Thank you very much.
I have uploaded my S1p Files here: https://drive.google.com/open?id=1tvyq0WUUgdyOoqCcmBzno5r9hHbNvpGq
I‘m sorry. In our country we can’t open this website. So I have to bother you to email this file to me. My email is zxf123465@163.com. If having more information about FDR/TDR, please teach me. Thanks a lot.
!S – Parameter data, F S11
10000000 0.886622058 75.806693108
How to translate to 0.21739453+0.85955703j
Dear nuclearrambo :
I used E5071C to get S11 data like below. The cable lenght is 30cm, one port connected the VNA, another port was open.
Using the S11 data to calculate the distance I got the wrong result. Please tell me why, thank you very much.
# MHz S RI R 50
!freq ReS11 ImS11
10.000 0.00 0.00
11.900 -0.01 0.00
13.800 -0.01 0.00
15.700 -0.02 0.00
17.600 -0.01 0.00
19.500 -0.01 0.00
21.400 -0.02 0.00
23.300 -0.01 0.00
25.200 -0.03 0.00
27.100 -0.03 0.00
29.000 -0.04 0.00
30.900 -0.04 0.00
32.800 -0.04 0.00
34.700 -0.04 0.00
36.600 -0.06 0.00
38.500 -0.04 0.00
40.400 -0.05 0.00
42.300 -0.06 0.00
44.200 -0.07 0.00
46.100 -0.08 0.00
48.000 -0.08 0.00
49.900 -0.09 0.00
51.800 -0.09 0.00
53.700 -0.12 0.00
55.600 -0.13 0.00
57.500 -0.13 0.00
59.400 -0.15 0.00
61.300 -0.17 0.00
63.200 -0.19 0.00
65.100 -0.22 0.00
67.000 -0.23 0.00
68.900 -0.23 0.00
70.800 -0.25 0.00
72.700 -0.26 0.00
74.600 -0.28 0.00
76.500 -0.28 0.00
78.400 -0.29 0.00
80.300 -0.31 0.00
82.200 -0.32 0.00
84.100 -0.34 0.00
86.000 -0.36 0.00
87.900 -0.36 0.00
89.800 -0.36 0.00
91.700 -0.36 0.00
93.600 -0.38 0.00
95.500 -0.40 0.00
97.400 -0.42 0.00
99.300 -0.45 0.00
101.200 -0.45 0.00
103.100 -0.45 0.00
105.000 -0.44 0.00
106.900 -0.42 0.00
108.800 -0.40 0.00
110.700 -0.41 0.00
112.600 -0.38 0.00
114.500 -0.39 0.00
116.400 -0.38 0.00
118.300 -0.40 0.00
120.200 -0.41 0.00
122.100 -0.40 0.00
124.000 -0.41 0.00
125.900 -0.42 0.00
127.800 -0.42 0.00
129.700 -0.42 0.00
131.600 -0.43 0.00
133.500 -0.43 0.00
135.400 -0.44 0.00
137.300 -0.45 0.00
139.200 -0.45 0.00
141.100 -0.46 0.00
143.000 -0.46 0.00
144.900 -0.45 0.00
146.800 -0.47 0.00
148.700 -0.48 0.00
150.600 -0.46 0.00
152.500 -0.47 0.00
154.400 -0.48 0.00
156.300 -0.48 0.00
158.200 -0.49 0.00
160.100 -0.46 0.00
162.000 -0.49 0.00
163.900 -0.49 0.00
165.800 -0.49 0.00
167.700 -0.49 0.00
169.600 -0.50 0.00
171.500 -0.50 0.00
173.400 -0.51 0.00
175.300 -0.49 0.00
177.200 -0.52 0.00
179.100 -0.52 0.00
181.000 -0.51 0.00
182.900 -0.50 0.00
184.800 -0.53 0.00
186.700 -0.52 0.00
188.600 -0.52 0.00
190.500 -0.53 0.00
192.400 -0.53 0.00
194.300 -0.53 0.00
196.200 -0.54 0.00
198.100 -0.54 0.00
200.000 -0.55 0.00
Hi Salil,
If there is a load like for example 50 Ohms, is it possible to modify the script to use
the 2nd peak of the plot from the source, so we can have the distance from the
source to the load?
Thanks,
neb
It is possible but I didn’t quite get what you want to do exactly.
Hi Salil,
The issue was resolved by recalibrating my nanoVNA.
Anyway, with regards to your other script with impedance plot, can
we compute for the Impedance of the load from the plot? I use Z_Load = step_response_Z [idx_pk [0]] ,
is this correct or not?
Thanks,
neb
Another use for this would be to calculate velocity factor from known lengths of cable and once you’ve the velocity factor I think adding a known load would allow the measurement of cable impedance.
Please help me to run this script under the windows power shell ! I don’t know how to make this !
Can we use this meter to measure the balance cable left in a drum , progressively reducing as one starts cutting and using .
Thanks
sarma
Yes you can do that for sure. The new firmware comes with the TDR feature. You can do this measurement on the nanovna itself.
Hello,
Have a look at the new 3GHz NanoVNA V2 aka S-A-A V2. Has transform built in and the source is fundamental not harmonic based.
https://groups.io/g/NanoVNA-V2
I bought mine with the better cable set from http://www.randl.com IIRC about 70.00 USD
W3OHM
I will be reviewing it this weekend!
Have you tried a script to reverse the computation, knowing the exact length of the cable and determining its velocity factor?
Works really well with several instruments. I’ve done it long before we started using NanoVNAs because I needed 75 ohm cable 1/4 wave stubs for various bands for full wave loops. I had found that , for instance, RG6 which was supposed to have 88 percent velocity factor actually had 80 percent. A huge error would have been generated If I had use 88 percent !
There are a number of programs that can be used with the NanoVNA . I’ve been using NanoSaver. Anyone have a favorite ?
I have been mostly using the default program and nanovna saver as an alternative.
Hello Salil,
You’ve written a great article about using the NanoVNA and I can’t wait to dive into it. BUT… there’s a problem. I have to disable JavaScript to safely visit, because it looks like your site has been compromised, and it’s pushing out malware to visitors. In fact, it’s about impossible to read because of all the redirects. I don’t know the first thing about fixing this (aside from getting your hosting service to update and clean up WordPress, or to just stop using wordpress) but it’s a real shame because it’s some great work you’ve shared, especially the cable length stuff.
Thanks for bringing it to my attention. I will check whats wrong.
Another thing you can do with a known long and short length of cable is to measure the time taken for the signal to pass through the connectors. This is interesting because it turns out for a small 42cm coax cable the connectors account for about 10% of the cable length. So use long cables and don’t use adapters for your feed cables!