
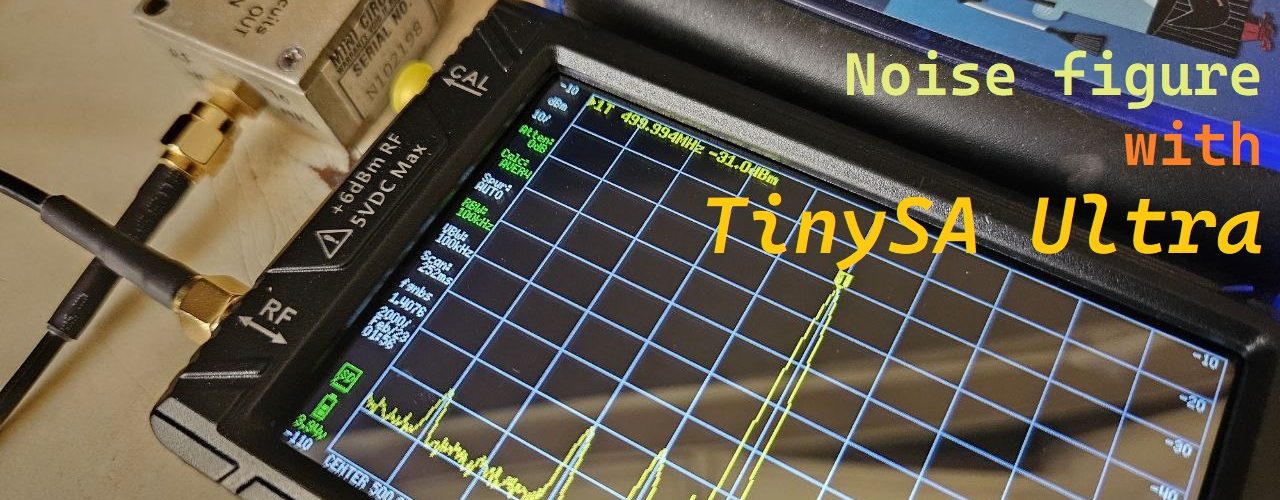
Noise Figure measurement with TinySA Ultra
In an article I wrote long time ago, I measured the noise figure of an amplifier using only a spectrum analyzer. The method I used was relatively simple but it took some mathematical understanding and some manual calculations.
A few years ago, compact, affordable RF instruments started making an entry into the hobbyist market. Being open-source, everyone loved them and a lot of people contributed into the betterment of those RF instruments. I reviewed the NanoVNA and the NanoVNA v2 when they were just starting to become popular back in the day. I wrote quite a few articles about those instruments which you can find on this blog. The low cost VNAs were far apart from the multi-thousand-dollar beasts that still dominate the market today but their performance was good enough for someone having no budget to purchase such costly instruments. They quickly found their way into the hands of startups, hobbyists and universities. The NanoVNAs were good to characterize 2-port networks such as filters, amplifiers, cables, etc.
At the time, people with low budget preferred to use SDRs for signal analysis/spectrum analysis. In no time, we had the TinySA show up in the online markets. It only worked up to 800 MHz but it was good enough for low frequency stuff. It did everything a large, expensive spectrum analyzer could do, only slowly. Later, the TinySA Ultra mode stretched the frequency limit all the way to 6GHz.
In this article, I will be showing the noise figure measurement capability of the TinySA Ultra. It works on the same principle I described in my previous article here. It only does it better and you don’t have to do manual calculations to arrive at the noise figure.
Step 1: Measure the gain of your amplifier
The very first step involves obtaining the gain measurement of the amplifier. For this, we need some form of RF source to inject a signal into the input of the amplifier. Eventually, we measure the output power level from the amplifier. We would be performing our measurements at 500MHz.
- Connect the RF signal source directly to the spectrum analyzer. Make sure the RF source does not exceed the power level limit of the TinySA ultra. We don’t want to damage our instrument.
- Note down the power level on the spectrum analyzer.
- Now insert the amplifier between the RF source and the tinySA ultra.
- Note down the power level you observe after the amplifier.
- Compute the gain
\(Gain(dB) = P_{out} – P_{in}\)
Here, both the powers are in dBm.
If required, you can also use an attenuator to limit the power from exceeding.
Measuring the input power
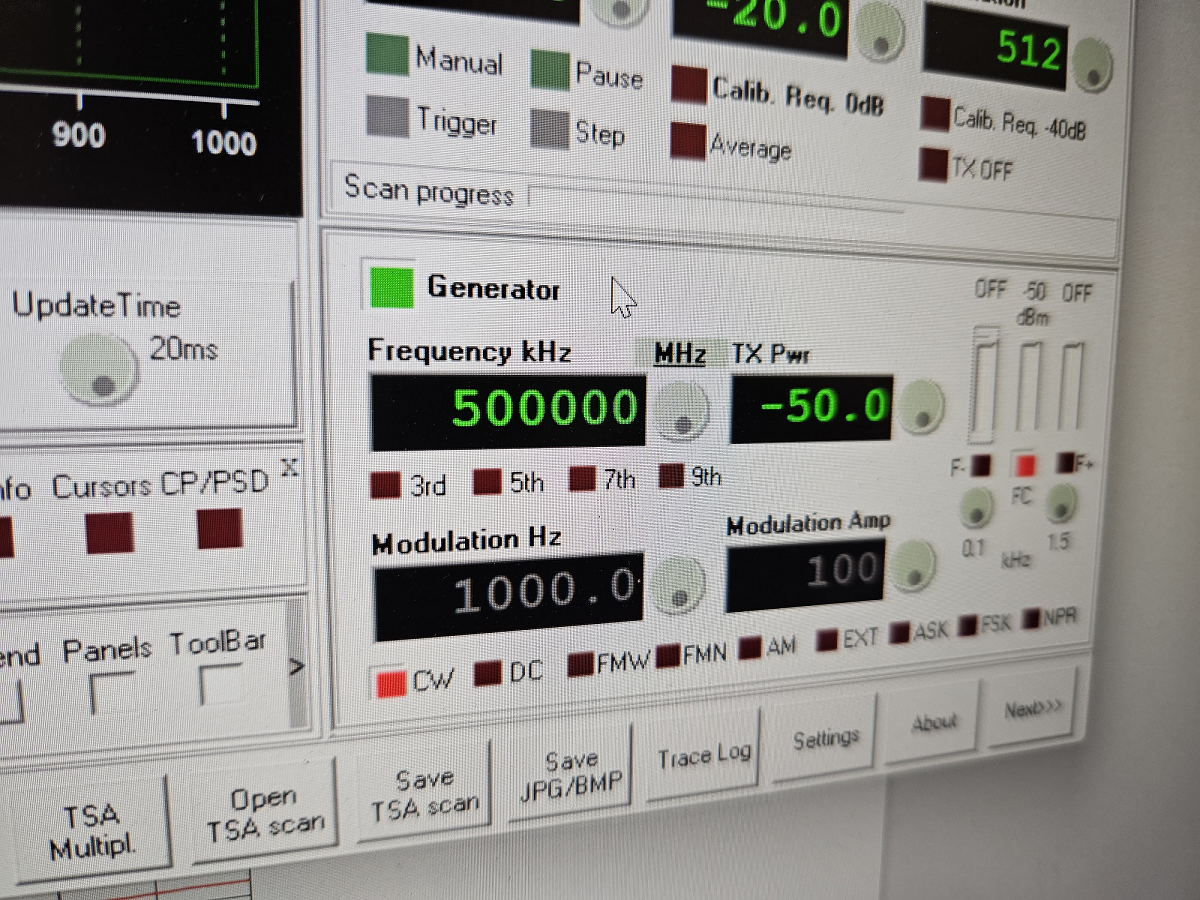
You can use any RF source for this purpose that’s capable of generating low output powers. It’s recommended to use lower power levels in the range of -50dBm to -30dBm while testing amplifiers. We don’t want to damage the input stage of the tinySA with excessive power. I used the PlutoSDR as my RF source controlled by the SATSAGEN software. This is my first time using it and I totally recommend giving it a try.
I used the “generator” mode to use PlutoSDR as an RF source and I set the frequency to 500MHz. Honestly, I would usually go for higher frequencies but I don’t have any amplifier at the moment to use.
I connected the PlutoSDR’s TX port directly to the TinySA ultra and measured the power.
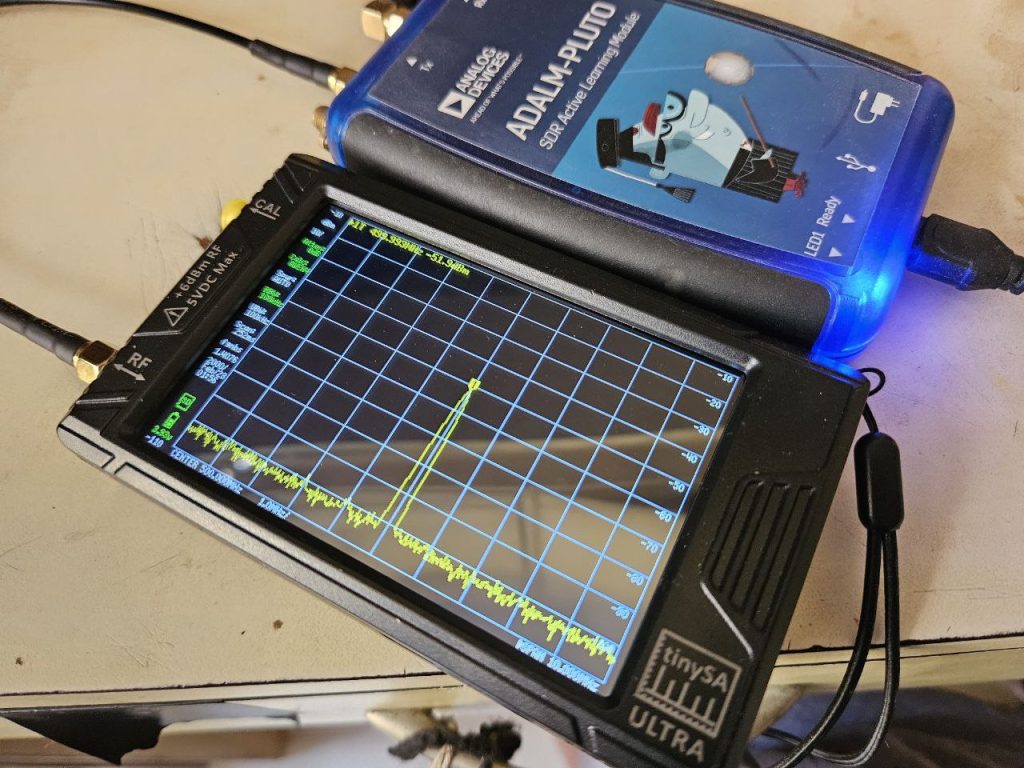
I set the power level to -50dBm. Correspondingly, I connect the PlutoSDR to the tinySA ultra and observe the power level of -51.9 + 0.1dBm. Additionally, I also enabled trace averaging for stable measurement.
Measuring the output power
Now, connect the amplifier to the PlutoSDR and measure the output power. The amplifier would amplify the signal and we should see more power at its output.
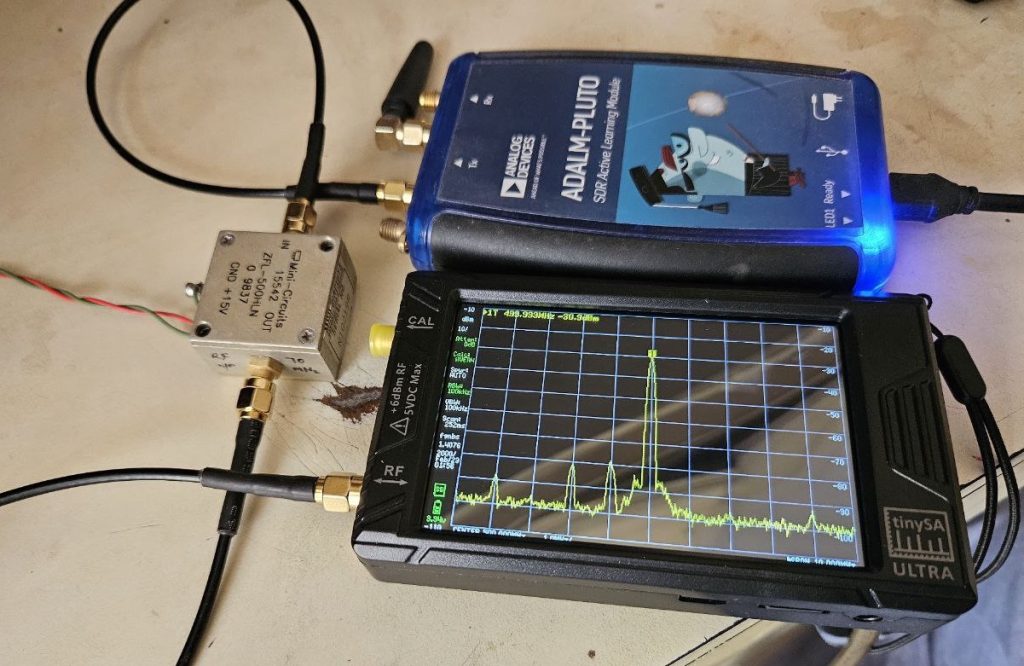
We see an output power of -31dBm + 0.2 after the amplifier. Therefore, we can now calculate the gain of the amplifier as follows.
\(Gain = P_{out} – P_{in} dB\)
\(\begin{equation} \begin{split} Gain & = -31dBm – (-51.9dBm) \\ &= 20.9dB \end{split} \end{equation}\)
Therefore, we can conclude that the gain of the amplifier is between 20 dB and 21 dB. I am using the Minicircuits amplifier ZFL-500HLN. Its datasheet, clearly states the gain to be exactly around the measured value.
Step 2: Measure the Noise figure
This stage is a two-step process.
- Measure the inherent noise figure of the tinySA ultra
- Measure the noise figure of the DUT
The inherent noise figure of the tinySA
To enter the noise figure measurement mode, Tap the screen > Measure > More > Noise figure.
While in the noise figure mode, connect a 50 Ohm termination at the input of the spectrum analyzer. Give it roughly 30 seconds to settle down. Now, press the “Measure tinySA NF” button. Furthermore, press the “Store TinySA NF” button. Doing this compensates for the inherent noise figure of the tinySA ultra. The NF now shows as 0.0 after performing these steps.
The noise figure of the amplifier
Connect the amplifier’s output port to the spectrum analyzer’s input. Additionally, terminate the amplifier’s input port with a 50 ohms load. On the TinySA ultra, press the “Measure AMP NF” button. It immediately prompts you to enter the gain of the amplifier. Enter the amplifier gain that we already measured earlier. An accurate gain measurement helps achieve an accurate noise figure measurement. Immediately after entering the gain, the TinySA starts showing the noise figure of the amplifier.
The tinySA ultra uses the “gain method of noise figure measurement” which I explained in an earlier article.
We are able to observe a noise figure of 3.1 dB which is close to what the datasheet defines. The measurement is off by less than 1 dB. The datasheet mentions the noise figure to be around 3.97dB.
Conclusion
The TinySA Ultra gives us the ability to perform most of the spectrum analyzer functions at a very low cost. It’s a powerful device that greatly enhances the capabilities of a hobbyist. We are going to see a lot more low-cost instruments popping up in the hobbyist space in the coming years and I am very excited for the future.
First you wrote “We would be performing our measurements at 2GHz.” but actually you are doing measurements on 500 MHz. Please correct this.
Thanks for sharing your experience! Namaste _/\_
Another misprint: “We see an output power of 31dBm + 0.2 after the amplifier.” should be “-31dBm”.
Edited. Thanks for pointing out.